Clinical estimation of the jugular venous pressure (JVP) has been at the heart of bedside cardiology for the past 100 years. Observation and description of the waveform used to be central to the derivation of a clinical diagnosis. As technology has rapidly developed over the past 25 years, the bedside method of JVP estimation and description has all but disappeared. But need it be abandoned? The conditions, which today cause an elevated JVP, are very different from those that were prevalent three decades ago. Rheumatic valve disease has all but disappeared in the UK, but heart failure caused by myocardial disease is now much more common. The outlook for patients with unoperated congenital heart disease was poor, but diagnostic and surgical advances in the last 50 years have made survival commonplace. Lifelong surveillance is required in all but the simplest cases.

Imaging of the heart can be done with numerous technologies, but none can reproduce observation of the JVP (or the stethoscope for that matter), which has been reduced to a mere curiosity. The JVP has often been regarded as a difficult clinical sign to interpret,1 and many textbooks have not helped in this respect. The section on ‘jugular venous pressure’ is often arcane and impenetrable. This representation is most exquisitely countered by an excellent film made by Paul Wood in 1957 and available from the Wellcome Institute at: http://archive.org/details/Thejugularvenous
pulse-wellcome
The purpose of this short piece is to simplify the understanding of the JVP for medical students and trainees in cardiology (and consultants not trained in the classical school).
Background

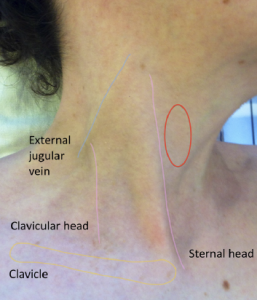
The JVP becomes elevated when there is an imbalance of blood flow into and out of the right heart either due to increased blood flow, e.g. left-to-right shunts, or increased resistance to right heart ejection, e.g. ventricular obstructive lesions, such as pulmonary stenosis, or atrial outflow impairment (valve stenosis, raised filling pressure, etc.). I will not discuss these lesions here. The imbalance is overcome by a hydrostatic pressure column in the capacitance veins of the thorax and neck. In some people, the normal venous pressure can be observed in the supine position as a gentle oscillation of the skin in the anterior triangle of the neck (bounded by the clavicle and the two heads of sternomastoid muscle as shown in figure 1). This is caused by filling of the collapsed internal jugular vein at various phases of the cardiac cycle (the external jugular is not a substitute as it may be impeded by fascia, etc.). If the venous pressure is raised, it is conventional to observe the JVP with the patient resting on a couch with the upper resting back at an angle of 45° and using the reference point of the sternal angle as an arbitrary zero point. The height of the JVP is the minimum height above the sternal angle at which the pulsations or, more correctly, the deflections of the skin are not seen. If the venous pressure is very high the patient can be resting at higher angles. As shown in Wood’s film, the best way to reveal the movement of the skin is by shining a pen-torch at a tangent to the area, such that any prominence will cast a long shadow.
Waves
The four main waves of the JVP are described as follows, beginning with the atrial event:
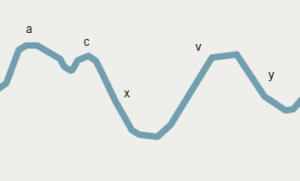
- An outward movement of the skin – the ‘a’ wave, which corresponds to atrial systole. The ‘c’ wave, after ‘a’, is of little or no clinical significance, but must not be confused with the systolic wave.
- An inward movement of the skin – the ‘x’ wave, which follows the ‘a’ wave and corresponds with a decrease in right atrial (RA) pressure.
- An outward movement – the ‘v’ wave, which follows the ‘x’ wave in the JVP, and corresponds to an increase in RA pressure during filling after tricuspid valve closure and the subsequent posterior movement of the tricuspid annulus to the diastolic position.
- An inward movement – the ‘y’ descent, which is caused by rapid emptying of the RA.
These events can be seen in a normal RA pressure recording, but are less easily observed in the normal JVP. However, when it is elevated the deflections are more prominent, especially if there is a ‘dominant wavelet’. With the patient supine and resting back at about 45 degrees to the horizontal (as mentioned in all classical texts), the venous pulse is best interpreted by feeling the contra-lateral carotid pulse with the thumb (not three fingers as there are three times more arteries in these than in one thumb!) and listening to the heart sounds with the stethoscope applied to the praecordium. If there is an electrocardiogram (ECG) monitor near the bed, that information may also be incorporated. If the venous wavelets are not seen, then lower the height of the head and backrest. Gently palpate the liver to push blood towards the heart.

The venous wavelets are usually represented by a diagram labelled ‘a, x, v, y’. Such a diagram (figure 2), in the absence of the arterial events of the cycle, is not readily understood. But when superimposed on the arterial pulse and heart sounds, its secrets are immediately revealed. This diagram is referred to as the ‘cardiac cycle’, and can be found in most textbooks of physiology and some of the better modern cardiology texts. It is not necessary to reproduce this here. Instead, I will show how the four wavelet phenomena listed above can be represented in a simple 2 × 2 matrix, which is an excellent aide memoire (figure 3).

Aide memoire
It can be with the pulse – i.e. it is a diastolic phenomenon. The ‘x’ wave is an inward movement or collapse of the internal jugular vein, synchronous with the pulse, so it is a systolic phenomenon. Similarly, the ‘v’ and ‘y’ waves are systolic and diastolic, respectively. The key in all this is to look for a dominant wave, and then decide whether it is inward or outward, synchronous or not synchronous with the pulse. Even if no dominant deflection can be identified, for example in a patient with cardiogenic water retention or ‘heart failure,’ the venous wavelets can often still be identified.
Mechanism of dominant deflection
The final step is to work out the underlying mechanism of the dominant deflection, not forgetting that it is a manifestation of the right heart only; some examples include:
- ‘a’ waves – right ventricular (RV) hypertrophy, RV outflow or inflow obstruction. It is caused by increased resistance to atrial emptying. It may coincide with left heart fourth heart sound, if the right and left ventricles are similarly afflicted.
- ‘x’ descent – nearly always seen in pericardial effusion with tamponade. It is caused by contraction of the ventricles in a fluid-containing sac. The space left is taken up by atrial expansion, leading to a sudden fall in intra-atrial pressure.
- ‘v’ wave – otherwise referred to as a ‘systolic’ wave when prominent. Typically found in tricuspid regurgitation of any cause. It coincides with a pulsatile liver, if present.
- ‘y’ descent – this is a hallmark of constrictive pericarditis,2 where the visceral and parietal layers of the pericardial sac are fused so that, when the ventricles contract, they pull against the pericardium and bounce back in diastole, causing a sudden increase in ventricular filling and atrial emptying. Its nadir can coincide with a filling sound or pericardial knock. An ‘x’ descent can co-exist giving two dominant deflections and a secure bedside diagnosis.
The JVP is not complicated. With a little practice and some expert guidance (if there is any remaining) the trainee can impress colleagues and seniors.
Conflict of interest
None declared.
References
1. King A. “JVP not seen.” Student BMJ 2009;17:b1097. http://dx.doi.org/10.1136/sbmj.b1097
2. Wood P. Diseases of the Heart and Circulation. Third edition. London: Eyre and Spottiswood, 1968.
