Electrocardiogram (ECG) is the most common cardiac investigation provided in primary care and accepted as core medical practice, yet little research evidence exists. In order to gather information on ECG provision in primary care and provide a training and competence analysis, a postal survey of 395 general practices within the North of England Cardiovascular Network area was conducted.
A total of 119 practices responded (30.1%) of which 91 (76.5%) recorded ECGs in-house. An average of 34.7 ECGs per 1,000 patients were recorded within 12 months (1.4–114/1,000). Of practices recording ECGs, 86% also interpreted the results themselves. Of staff recording ECGs, 72% received training, which was carried out mostly in-house, and 52.9% of practitioners interpreting results had received some training. A low level of confidence to recognise 10 important ECG abnormalities was reported.
Our survey confirmed that the majority of GP practices record and interpret ECGs. Few received formalised training and assessment in recording and interpreting ECGs. This was reflected in a low level of confidence to recognise critical ECG abnormalities.
Introduction
Electrocardiograms (ECGs) are regularly used in primary care both for diagnostic and screening purposes, and to support referral to specialist services. Over the past decades, these ECGs have increasingly been recorded and interpreted within primary-care settings. However, little is known about how well clinicians in general practice are trained to record and interpret ECGs. There is some evidence that interpretive skills in primary care are variable1-3 and anecdotal evidence exists that recording quality may be suboptimal. This article outlines the process and findings of a survey undertaken by the North of England Cardiovascular Network (NECVN) to establish the level of ECG provision in primary care and gain an understanding of ECG training and skills within primary healthcare teams. It was intended that the survey provide the network with a training needs analysis and inform and direct ECG service development in the North-East of England.
Methodology
Information was gathered via a postal questionnaire, which was accompanied by a supporting letter from the NECVN outlining the purpose of the survey. The questionnaire comprised 15 questions, which were arranged in three sections: ECG recording, ECG interpretation and governance.
It was sent to all general practices (n=395) in the network area. The practices were given the option of completing an online version of the questionnaire through the NECVN website. One questionnaire was completed per practice by its lead clinician. The initial timescale of four weeks to respond was increased by two weeks and reminders were sent out to practices by email.
Results
Response rates
A total of 119 practices responded, representing an overall response rate of 30.12% (range by primary care trust [PCT] 7.4–46.8%). One PCT did not submit any completed questionnaires but subsequently informed the ECG task group that a secondary-care led ECG service was commissioned for the area; it was, therefore, excluded from the result analysis. The practices that submitted questionnaires provide care for 798,814 patients, representing 31.75% of the network population.
ECG recording
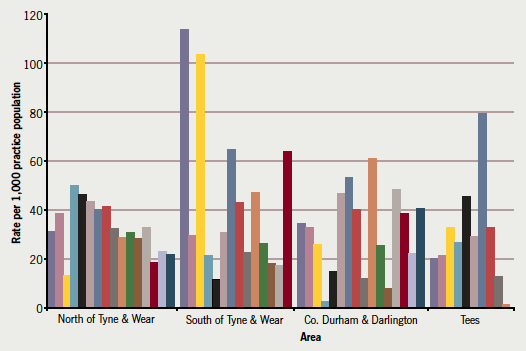
ECGs were recorded in 91 (76.5%) of the responding practices; this varied between PCTs and ranged from 40% to 100%. The majority of ECGs were recorded by practice nurses and healthcare assistants. An average of four healthcare professionals per practice recorded ECGs. Practices that performed ECGs in-house recorded, on average, 242 ECGs within the last 12 months, while practices who referred elsewhere requested 180 ECGs within the same period. The difference of recording ECGs between individual practices when adjusted for population size varied from 1.4 ECGs per 1,000 population to 114/1,000 (figure 1). The mean was 34.7 ECGs per 1,000 patients.

Overall, 72% of practices had staff who had received some form of ECG training. The majority (62%) had received in-house training, 22% had accessed external training while 16% had received training delivered by their PCT. An assessment was undertaken in 59% of the training courses and refresher training was accessed rarely (18%).
Approximately 65% of practices had systems in place to ensure that machines were maintained and calibrated correctly. The responsibility for this lay predominantly with nursing staff (49%) or the practice manager (21%).
Interpreting ECGs
Overall, 86% of ECG recording practices had a member of staff who interpreted the ECGs and 20% of practices used secondary care to report all or at least some of their ECGs, either through formal or informal systems. None of the practices used telemetry to facilitate interpretation. Of practices who recorded their own ECGs, 52% had ECG machines with an interpretive function. Over 65% of the practices that did not record ECGs used secondary care to interpret ECGs and 23% of practices relied on the report from an interpretive machine. In addition, 11.5% of non-recording practices identified that they had a member of staff who interpreted ECGs.
GPs were by far the largest group among primary-care staff who interpreted ECGs, but 10% of practices stated that they had nursing staff also capable of ECG interpretation.
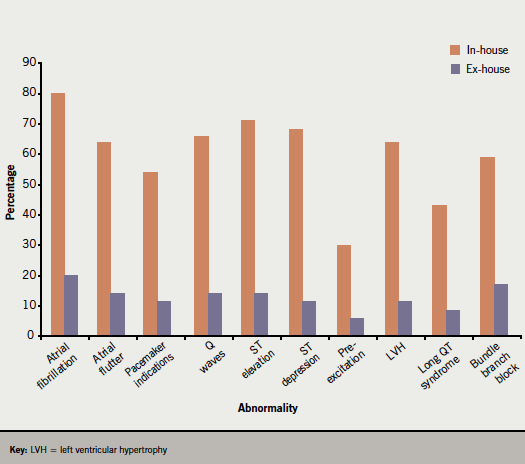
Practices were asked to identify ECG findings from a list of 10 significant abnormalities that they could interpret with confidence. First, there was a clear difference in confidence between practices recording their own ECGs and practices that were not. Second, even recording practices had low levels of confidence in detecting important abnormalities (figure 2).

Sixty-three practices (52.9%) reported that someone in their practice had received training in ECG interpretation. Around half of those stated that the training had been carried out in-house. A further 25% of practices commented that no training had been received in ECG interpretation.
Comments from practices focused generally on low levels of confidence in interpreting and recording ECGs as well as on reliance on interpretive software. In addition, several requests for external reporting services were raised.
Discussion
The recording and interpretation of ECGs in primary care has become increasingly common and many GPs have accepted it as part of core general medical services. However, there are limited data on the provision of ECG recording and interpretation in general practice. Even less is known about the level of training and quality of the service.
It is recognised that response rates for postal questionnaires are low.4,5 Therefore, a response rate of 30.12% was in line with expectations. Although 119 responding practices provide care for a third of the network population, it is difficult to know if our results are representative and can be extrapolated to the whole population.
The survey confirmed that the majority of practices (76.5%) record ECGs in-house. While it was interesting that practices which performed ECGs recorded 25% more ECGs than practices using external providers, it was striking that the number of ECGs per 1,000 population varied by as much as 20-fold between practices. Some variation might be explained by demographics (e.g. very young or old population) or by the range of conditions managed in different practices depending on available expertise. Nevertheless, it is unlikely that these considerations can fully account for such large differences. We suspect that differences in quality of care might also play a role, although this is difficult to substantiate as it is largely unknown how many ECGs per given population represent high quality care. This is an area that future research needs to address.
The Society for Cardiological Science and Technology6 outlines requirements for standards of training and ongoing assessment of those recording ECGs. This is an important aspect as only correctly recorded ECGs of sufficient quality allow meaningful conclusions. It is of concern that our survey results showed only 72% of practices had trained staff. Furthermore, training was commonly provided in-house and without formal assessment.
As expected, only a small number of practices that use outside providers to record ECGs interpret the results in-house, whereas the vast majority of recording practices interpret their own ECGs. Practices were asked to rate their confidence in identifying 10 significant ECG abnormalities. It was concerning that for most abnormalities around a third, and for some over half, stated they were not confident to identify these abnormalities. Another concern was that a quarter of non-recording practices relied on interpretive ECG software. These findings are perhaps not surprising as only three-quarters of practices had received some form of training and half of it was carried out in-house. The results of course need to be viewed cautiously as this was self-reported confidence without assessment,7 by only one member of staff per practice. If there was more than one clinician interpreting ECGs in a surgery, the answer given might not have been representative for other clinicians.
We believe the ECG is an easily performed valuable test and should be available to patients in a primary-care setting, but needs to be carried out by trained staff to achieve quality recordings. A lack of training was clearly identified and, as a result, the network has facilitated the development of an ECG recording course in conjunction with the Society for Cardiological Science and Technology. Delivery of this course will be piloted shortly. ECG interpretation, on the other hand, is complex and requires knowledge, skill and practice. This is much more difficult to ensure in the large and diverse workforce that general practice represents. Various attempts have been made to overcome this issue. Bradford PCT, for example, made the recording and interpretation of ECG an enhanced service that required the provider to demonstrate quality and governance in return for payment. Another approach has been to support the recording of ECGs in primary care but to outsource interpretation to specialist providers making use of remote data transfer. The latter is being piloted in Newcastle. Both approaches, of course, incur costs, although they will reduce misdiagnosis and have even been shown to reduce hospital referral. It appears unlikely that a uniform approach will prove successful and local solutions to this complex area will have to be found.
Conflict of interest
None declared.
Key messages
- The majority of GP practices recorded and interpreted their ECGs
- There was a large variation in volume of recorded ECGs amongst practices
- Many practioners have not recieved training in recording ECGs and even fewer in interpreting ECGs
- A low level of confidence in recognising major ECG abnormalities was reported
References
- Sur DK, Kaye L, Mikus M, Goad J, Morena A. Accuracy of electrocardiogram reading by family practice residents. Fam Med 2000;32:315–19.
- Mant J, Fitzmaurice DA, Hobbs FD et al. Accuracy of diagnosing atrial fibrillation on electrocardiogram by primary care practitioners and interpretative diagnostic software: analysis of data from screening for atrial fibrillation in the elderly (SAFE) trial. BMJ 2007;335:355–60. http://dx.doi.org/10.1136/bmj.39227.551713.AE
- Salerno SM, Alguire PC, Waxman HS. Competency in interpretation of 12-lead electrocardiograms: summary and appraisal of published evidence. Ann Intern Med 2003;138:751–60.
- Edwards P, Roberts I, Clarke M et al. Increasing response rates to postal questionnaires: systematic review. BMJ 2002;324:1183. http://dx.doi.org/10.1136/bmj.324.7347.1183
- Barclay S, Todd C, Finlay I, Grande G, Wyatt P. Not another questionnaire! Maximising the response rate, predicting non-response and assessing non-response bias in postal questionnaire studies of GPs. Fam Pract 2002;19:105–11. http://dx.doi.org/10.1093/fampra/19.1.105
- The Society for Cardiological Science and Technology. Clinical guidelines by consensus. Recording a standard 12-lead electrocardiogram. An approved methodology (2010). Available from: http://www.scst.org.uk/resources/consensus_guideline_for_recording_a_12_lead_ecg_Rev_072010b.pdf
- Davis DA, Mazmanian PE, Fordis M, Van Harrison R, Thorpe KE, Perrier L. Accuracy of physician self-assessment compared with observed measures of competence. JAMA 2006;296:1094–102. http://dx.doi.org/10.1001/jama.296.9.1094
