In this new regular series ‘ECGs for the fainthearted’ Dr Heather Wetherell will be interpreting ECGs in a non-threatening and simple way. Confident interpretation of ECGs is fast becoming a dying art form. What’s more, it’s an art form that any good scientist can enjoy! ECGs are open to interpretation. The fun lies in solving the puzzle.
1. Don’t make an easy job, hard
Reading a good quality electrocardiogram (ECG) is easy. Add a wandering baseline, interference (electrical or muscular) or movement artifact, and it can be impossible. If it is important enough to request an ECG in the first place, it is important enough to request for it to be repeated if it is illegible. Asking patients to hold their breath for a couple of seconds can help, or, if fine tremor is a problem, try moving the limb leads up to a more proximal position on the arms.
2. Switch off (or cover up) the computer interpretation
Possibly, one of the most common reasons for patients, with no cardiac symptoms, being referred to the Rapid Access Chest Pain Clinic, is an inaccurate diagnosis of ‘possible anteroseptal infarct – probably old’ being made by the digital analysis (see tip 8). Most GPs are aware that these computer-generated diagnostics can be over sensitive, but, perhaps more alarming, is when cases of barn door atrial fibrillation (AF), for example, are reported as ‘normal sinus rhythm’. It happens. Whatever you do, don’t trust it.1,2 (Admittedly, once you’ve made your own interpretation, it can be reassuring to compare with the machine, but if different, don’t be afraid to go with your hunch.)
3. Know your 4 times table!
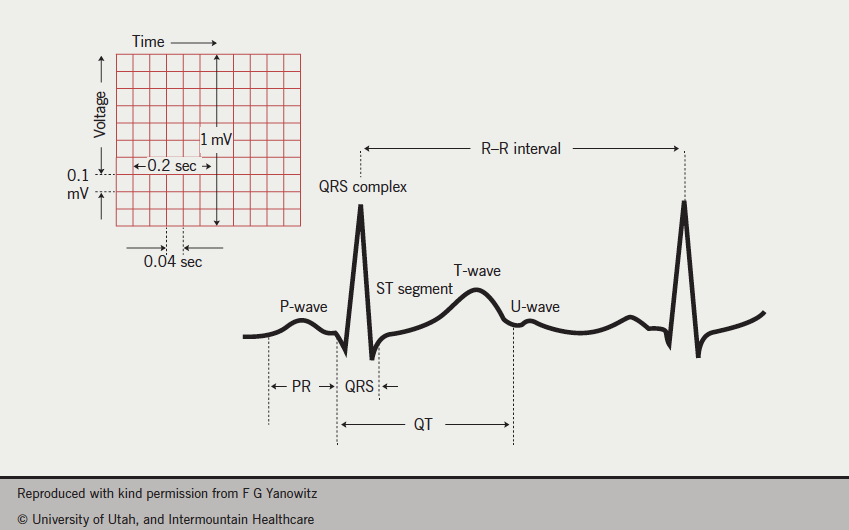
All you really need to know to spot a problem on the ECG is your 4 times table (OK, and the normal waveform interval values!) Assuming standard paper speed of 25 mm/s, then one small square = 0.04 s. The rest is easy (figure 1).

- The P-wave should be 2–3 small squares in duration (0.08–0.11 s)
- The PR interval should be 3–5 squares in duration (0.12–0.20 s)
- The QRS complex should be 1.5–2.5 small squares in duration (0.06–0.11 s)
- The QT interval should be 9–11 small squares (0.36–0.44 s)
4. A quick rate estimation helps diagnose blocks, and ectopic activity
To calculate the rate of aregular ECG, simply divide 300 by the number of large squares between two complexes.
For irregular rhythms, count the number of complexes between 30 large squares and multiply by 10 (30 large squares = 6 seconds, assuming standard paper speed of 25 mm/s).
In irregular rhythms, it is all the more importantto calculate both the ventricular and the atrial rate, separately. This helps establish any mathematical relationship between them (use blank paper to map them out). This is a really quick way of spotting 2:1 or 3:1 blocks, dropped beats, or random ectopy (see below, tip 5).
5. Heart blocks and memory blocks!
P-waves aren’t just about AF. The relationship of the P-waves to the QRS complex is the bread and butter of ‘heart block’ diagnostics.
If the rhythm looks irregular, check for P-waves (usually best seen, if present, in leads V1 and V2). If you can’t make out P-waves, and it is irregularly-irregular, then think AF. But, if you can see P-waves, it is useful to work out both the atrial rate and the ventricular rate, to determine any consistent relationship between them.
Damaged myocardium (commonly age related or old infarct trauma) gives rise to heart blocks. Heart blocks occur when there is any interruption of electrical impulse, either between its initiation in the sinus node and subsequent atrial depolarisation (sino-atrial, SA block – see below, tip 6), or during its journey between the atria and the ventricles (atrioventricular, AV block). Both of these types of block can be further subdivided into 1st, 2nd and 3rd degree. For more information on heart blocks visit: http://hcwetherell.blogspot.co.uk/2012/12/sino-atrial-node-dysfunction-and-sino.html
Heart blocks, unlike bundle branch blocks, indicate a non-sinus rhythm. Bundle branch blocks can occur in normal sinus rhythm, and signify a block in electrical conduction through the right or left branch of the bundle of His. Any widening of the QRS complex, beyond 2.5 small squares, should alert you to a total, or partial, bundle branch block. For more information about left bundle branch block and its causes visit: http://hcwetherell.blogspot.co.uk/2012/09/
ecgclass-case11-lbbb-full-discussion.html
6. Be very suspicious if you suspect sinus arrhythmia in the elderly
Sinus arrhythmia occurs with respiration in the young and healthy. The rise and fall of the heart rate is gradual, with respiration.
In the elderly, sinus arrhythmia is rare. Study the R–R interval, if the distance is always a multiple of the basic rate, then a sino-atrial (SA) block is far more likely in this age group. A SA heart block occurs when there is complete failure of the sinus node to depolarise the atrium. In a SA block, the P–P interval remains regular but an entire P–QRS complex will be occasionally missing.
7. When considering LVH, don’t just look at the chest leads
Interestingly, there is no one universally agreed criterion for left ventricular hypertrophy (LVH) by ECG. While LVH can only be truly diagnosed by echo measurement, there are various ECG ‘voltage criteria’ that can be suggestive of LVH.
Hypertension and aortic stenosis commonly cause a thickening of the left ventricular muscle, which gives rise to an LVH ‘strain’ pattern – a downwardly concave ST depression, with a flipped asymmetric T-wave. Strain pattern is usually greatest in the lead with the tallest/deepest QRS.
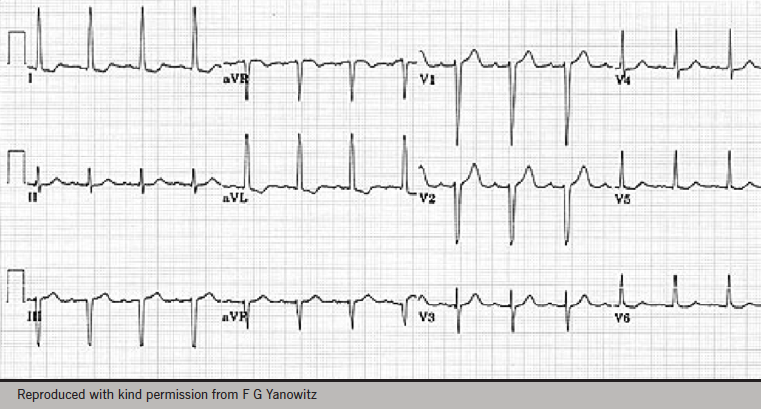
The left ventricle is represented by chest leads V5 and V6, so, in LVH, we expect the ‘R’ waveforms to be enlarged/tall in these leads. Conversely, we expect the ‘S’ waves to be deep in the right ventricular leads, that is V1 and V2. Many of us are familiar with the voltage criteria for LVH in the chest leads, i.e. the combined height/depth of the S-wave (in V1 or V2) plus the R-wave (V5 or V6) is ≥35 mm. However, this measurement is very affected by body habitus of the chest wall – a tall slim man, with little chest wall adipose tissue, may well have voltage criteria for LVH in the absence of any hypertrophy.
The limb leads are less affected by body habitus, so always take a glance at the amplitudes in leads I and aVL. Even without voltage criteria being met in the chest leads, criteria for LVH are met if leadI ≥12 mm, and/or leadaVL ≥11 mm (figure 2).

However, voltage criteria are cumulative, so the more leads which qualify, the more likely the accuracy of a diagnosis.
8. Digital readout ‘anteroseptal infarct, probably old’
If the patient has no cardiac symptoms, past or present, and an assessment of risk factors makes likelihood of old myocardial infarction (MI) seem remote, then take a close look at the ECG: are there really any pathological Q-waves?
First thing to check is whether or not there is anypositive upward deflection – no matter how small – which indicates an R-wave prior to the suspect Q-waves (zoom in if possible). If so, the deep waves are S-waves, not Q-waves at all.
Second, what about the amplitude and width of the Q-waves?
The precise criteria for pathological Q-waves is much debated, but, as a general rule of thumb, the Q-wave should be at least 25% as deep as the corresponding R-wave is tall, and in at least two contiguous leads.
The Novacode system3 further classifies ischaemic abnormalities in patients with no known history of myocardial infarction.
9. Bizarre ectopic waveform, or simple artifact?
Remember that each ‘column’ of leads on a 12-lead ECG trace, records the heart rate at the same moment in time, for all three leads in that column. So the first column simultaneously records the view from the limb leads (I, II and III). The recording will then switch to the second column, which in turn records simultaneous beats in the augmented limb leads (aVR, aVL, aVF). The third column records V1, V2 and V3, simultaneously, and the fourth records V4, V5 and V6.
While the heart rate and rhythm might well change between columns, within each of the columns it should always remain the same.
So, a genuine ectopic/anomaly will always appear in all three leads of any one column. A bizarre complex seen in V6 for example (figure 3), which isn’t present in V4 and V5, can only be an artifact – such as sudden movement of the electrode.

10. ST segments
Think of the ST segments in relation to the baseline. They should be described as isoelectric (i.e. baseline), elevated or depressed.
Elevated ST segments can be described as convex (e.g. STEMI), coved (e.g. Brugada type 1), saddle-shaped (e.g. pericarditis, Brugada type 2), or upsloping (e.g. seen in benign high take-off). To see examples of different patterns of ST elevation visit: http://hcwetherell.blogspot.co.uk/2012/07/different-patterns-of-st-elevation.html
Depressed ST segments can be described as upsloping (often normal on exercise, or very early ischaemia), horizontal or downsloping (correlating, respectively, to more progressive ischaemia).
Further information
If you’d like to polish up on your ECG skills further, or for more detailed explanations, and examples of cases, see www.KeepingECGsSimple.co.uk
This website can be used as stand-alone, but for Twitter users, it runs alongside a Twitter educational forum aimed at GPs, called #ECGclass. Run by Dr Heather Wetherell, via @ECGclass, new ECG cases are uploaded to this free interactive-discussion forum, on a fortnightly basis. No registration is necessary and the emphasis is on fun.
With grateful acknowledgment to Wetherell H. Ten top tips – ECG interpretation. Pulse 2013
References
1. Salerno SM, Alguire PC, Waxman HS. Competency in interpretation of 12-lead electrocardiograms: a summary and appraisal of published evidence. Ann Intern Med 2003;138:751–60. http://dx.doi.org/10.7326/0003-4819-138-9-200305060-00013
2. Salerno SM, Alguire PC, Waxman HS. Training and competency evaluation for interpretation of 12-lead electrocardiograms: recommendations from the American College of Physicians. Ann Intern Med 2003;138:747–50. http://dx.doi.org/10.7326/0003-4819-138-9-200305060-00012
3. Rautaharju PM, Park LP, Chaitman BR, Rautaharju F, Zhang ZM. The Novacode criteria for classification of ECG abnormalities and their clinically significant progression and regression. J Electrocardiol 1998;31:157–87. http://dx.doi.org/10.1016/S0022-0736(98)90132-7
