The article on pages 47–8, by Drs Derek Rowlands and Philip Moore, highlights the importance of maintaining our clinical skills at electrocardiogram (ECG) interpretation. The authors touch upon the unsatisfactory reliance on computer analyses. The frequent inaccuracy of computer-generated ECG interpretation is well recognised, yet how many of us in primary care, still fall back on this? The machine diagnostics can so easily mislead us. Always check it yourself, and consider your findings in conjunction with the clinical presentation.
Today, we’re doing a confidence test …
Would you challenge your ECG machine?
Let’s imagine, it’s Saturday morning and your practice flu-clinic is in full swing. Your practice nurses recently went on a cardiovascular course, during which it was suggested that they screen for atrial fibrillation (AF) in the elderly population by doing routine pulse checks. As such, they have been checking for ‘irregular pulses’ with each flu-jab given. Five asymptomatic people are invited back the following week for an ECG, each of which is shown to you, the GP.
Let’s look the recordings, one by one, and for simplicity let’s assume the same history for each ECG:
- The patient is a symptomatically well, 75 year old, who merely responded to the flu-jab invite, and, if indeed in AF, they would all fulfill the CHA2DS2-VASc criteria for treatment, and have no contraindications.
On whom are you going to initiate anticoagulation and rate control?
(Note the machine interpretation for each, then study the ECG and decide for yourself before reading on.)
ECG 1
This is not AF – ignore your machine
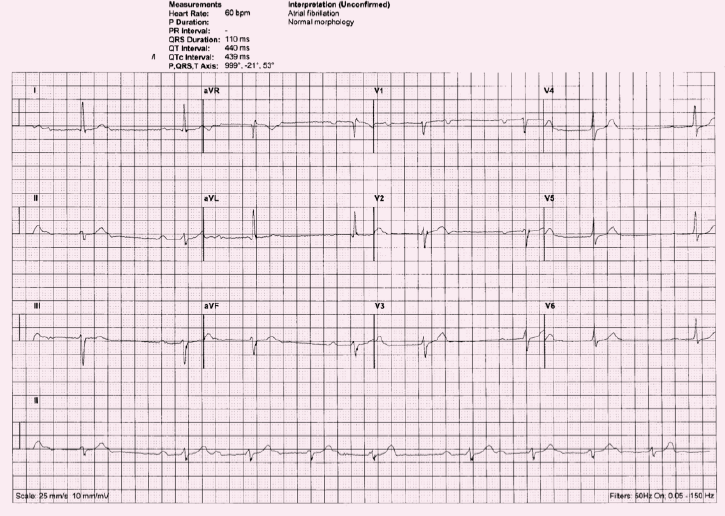
Study the rhythm strip … P-waves are clearly visible, but don’t have a consistent relationship to the QRS, i.e. the PR interval is variable. The rhythm is irregular.
Starting with the third complex on long lead II: this QRS complex is preceded by a P-wave, but the PR interval is prolonged (>5 small squares). The following complex has an even longer PR interval. The P-wave of the subsequent complex is so premature that it is lost in the previous T-wave. (Note the distorted shape of T-wave.) This series of four complexes is then followed by a pause, before the cycle repeats itself.
It’s a bit tricky without a longer rhythm strip, but on this 12-lead ECG, it looks like Mobitz type 1, second-degree heart block – Wenckebach.
Features of Wenckebach:
- PR interval progressively lengthens until P-waves fail to conduct
- PR interval then resets to normal
- The R–R interval progressively shortens
- Cycle repeats.
This is usually benign in the younger population – observe, check medications. In the elderly population, it probably warrants further investigation.
As it turned out this patient above actually required pacing – she was symptomatic during prolonged pauses on a subsequent 24-hour ECG.
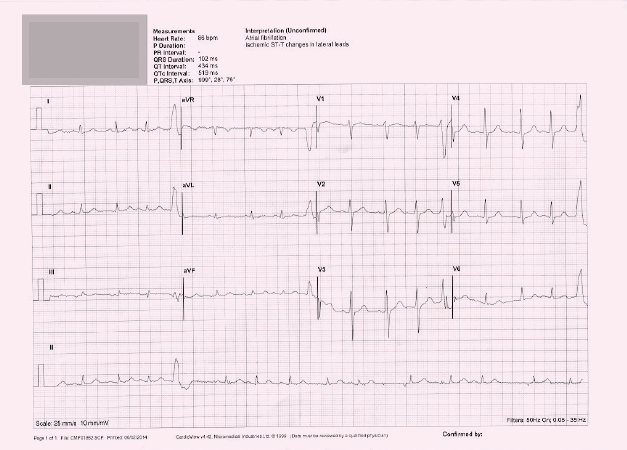
ECG 2
This is not sinus rhythm – ignore your machine!
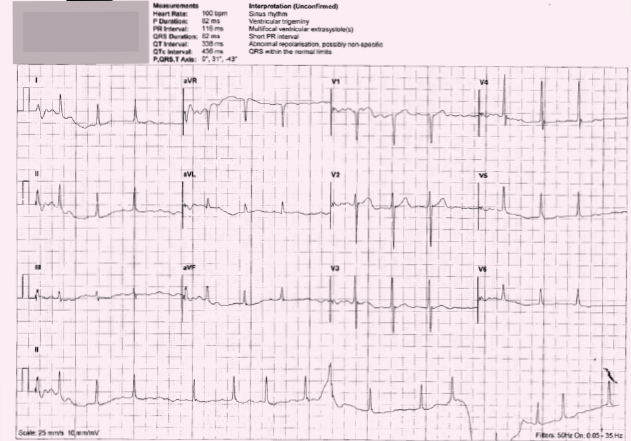
Can you see P-waves? If you are ever uncertain about P-waves, look carefully at V1 and V2 – these are the two leads in which P-waves are usually best seen. I can’t see them on this ECG. The rhythm is irregularly irregular. You guessed it. This is barn door AF – missed by the machine.
Neither has this patient got ventricular trigeminy or multi-focal extrasystoles. There is a wandering baseline on the rhythm strip at the bottom, typical of movement artefact, which will also account for the bizarre pattern in the middle, misinterpreted as ventricular ectopic. Note that it is seen in limb lead II (on rhythm strip) but not mirrored in the chest leads. Nor is there a short PR interval (unmeasureable without P-waves!).
ECG 3
You won’t be surprised to hear that it’s not AF and the machine is wrong again
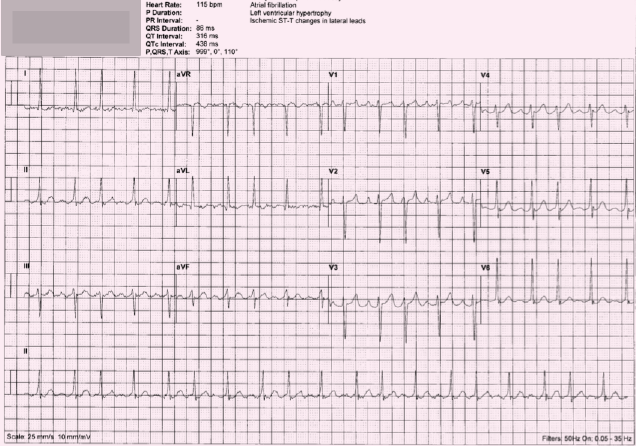
Dr Wetherell would like to make the following correction:
ECG 3 was mislabeled in the instalment of ‘ECGs for the fainthearted,’ published in the current issue of the journal (Br J Cardiol 2014;21:62–3). The ECG published shows atrial flutter. The patient concerned, an 83 year old lady, does in fact have confirmed atrial fibrillation, and the intended ECG showed clear P-waves and multiple nodal ectopics at a slower rate.
Many apologies for this error but thanks to those who picked this up and contacted me. It seems doctors make errors as well as machines!
But this one is a bit more tricky. You definitely need an element of suspicion, and a piece of paper to map the complexes here. The left ventricular hypertrophy (LVH) suggestion is more believable (voltage criteria met in lead I, and possibly aVL).
If you map out the rhythm strip, you will see that the interval between the first and second complexes is different to the interval between the second and third. BUT – the interval between the fourth and fifth complexes, is exactly the same as that between the first and second. In fact, if you ‘skip’ every third complex on the rhythm strip, the R–R intervals are identical. Every third complex is an atrial ectopic. This is atrial trigeminy.
There is a slight resting tachycardia here. The possible LVH, plus atrial ectopy, raises the suspicion of this being a manifestation of atrial hypertrophy. In this instance, re-assessment of blood pressure is advisable. In an otherwise well patient, atrial ectopy is often a benign finding and reassurance may be the only management necessary.
ECG 4
This is not AF – ignore your machine
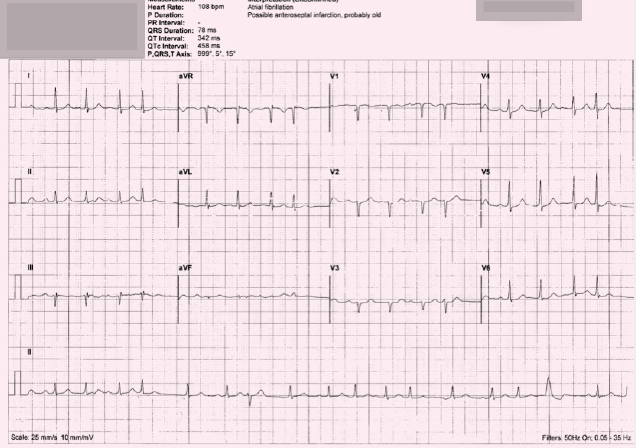
This ECG, as seen, may well be multi-focal atrial tachycardia, ideally we need a longer rhythm strip to help sort it out.
It is clearly irregularly irregular, with no fixed pattern, but there are some very clear P-waves, which seem appropriately associated with a normal QRS complex …
If you look at the lead II rhythm strip only:
- The first QRS seen, looks quite normal, and is preceded by a normal looking P-wave
- The fourth and sixth complexes, likewise, look normal
- The second complex, certainly looks like an atrial ectopic
- The fifth complex looks like an atrial escape beat (kicking in to compensate after a long pause)
- The eighth complex is a nodal ectopic (identified by the inverted preceding P-wave).
So, on this ECG alone, we can see lots of different patterns of atrial activity. This could be something called multi-focal atrial tachycardia. This is often seen in people with poor lung function, such as severe chronic obstructive pulmonary disease (COPD).
Multi-focal atrial tachycardia is characterised by an irregular atrial rate greater than 100 beats per minute, with at least three morphologically distinct P-waves and irregular P–P intervals. It is often short-lived and self-limiting. Treating any underlying condition, such as respiratory failure, is the mainstay of treatment. Rate control is not important, and if respiratory function is poor, may in fact make her feel less well. These patients can, however, go on to develop AF, so this needs to be borne in mind.
This lady had, in fact, been asymptomatic with a slower rate, when her irregular pulse was first detected. At the time of her ECG, she admitted to feeling a little light-headed and breathless. She did have marked COPD. When the ECG was repeated later, her rate had slowed down again, and her rhythm had reverted to a clear atrial trigeminy. One year later, she progressed to AF.
ECG 5
This is not AF – ignore your machine
Once again this ECG shows P-waves clearly visible (seen most clearly in leads V1–4). Although each normal P-wave seen appears to be followed by a QRS complex, on first glance it appears that not all the QRS complexes have a preceding P-wave. On closer inspection, however, there are abnormal P-waves present, rather than absent.
With the exception of the ventricular ectopic (VE), all QRS complexes have a preceding P-wave, but at least three different morphologies are seen – normal, biphasic, and inverted. The QRS complexes that are not preceded by a ‘normal’ P-wave, are atrial ectopics(also known as premature atrial complexes, PACs). Here, the cardiac impulse originates somewhere in the atrial tissue (i.e. a site of atrial ectopy) and travels rapidly through the normal atrio-ventricular conduction system (the Bundle of His) into the ventricles. As this conduction process is not slowed, the QRS is of normal, narrow morphology. This is in contrast to ventricular ectopic beats (ventricular premature complexes, VPCs), which originate somewhere in the ventricular muscle mass, resulting in a bizarre, broad QRS complex.
This ECG represents multi-focal atrial ectopic activity (MAE), but not multi-focal atrial tachycardia (MAT). This patient had presented with an irregular pulse, and as a result of this ECG has been started on warfarin and bisoprolol. A possibly indefensible action, had he gone on to have a significant bleed.
So there we have it. Why can’t our machines be as reliable as us? Until a time comes when we can be sure they are, SWITCH OFF your digital analyses and start LOOKING at the ECG!
Further information
If you’d like to polish up on your ECG skills further, or for more detailed explanations, and examples of cases, see www.KeepingECGsSimple.co.uk
This website can be used as stand-alone, but for Twitter users, it runs alongside a Twitter educational forum aimed at GPs, called #ECGclass. Run by Dr Heather Wetherell, via @ECGclass, new ECG cases are uploaded to this free interactive-discussion forum, on a fortnightly basis. No registration is necessary and the emphasis is on fun.
