Intra-coronary imaging has become a cornerstone of visualising atherosclerotic coronary artery disease and also to guide the therapy in selected high-risk cases. Optical coherence tomography (OCT) is an imaging modality quite similar to intravascular ultrasound (IVUS), but uses light instead of sound. In the second article on contemporary coronary imaging, the potential of OCT is discussed.
Introduction
Optical coherence tomography (OCT) uses near-infrared electromagnetic radiation, and cross-sectional images are generated by measuring the echo time delay and intensity of light that is reflected or back-scattered from internal structures in the tissue.1,2
Current OCT images are obtained at the peak wavelength in the 1,280–1,350 nm band that enables a 10–15 µm tissue axial resolution, 94 µm lateral resolution at 3 mm, and maximal scan diameter of 6–8 mm (about 10 times resolution as compared with intravascular ultrasound [IVUS]). There are two main technologies that can be used to obtain OCT images: time domain and frequency domain. Frequency domain OCT has the advantage of an improved signal-to-noise ratio allowing fast scanning with improved imaging quality.
OCT image acquisition
OCT cannot image through a blood field, and it requires clearing or displacing blood from the lumen by flushing. There are two basic techniques:
- The occlusive technique. During image acquisition, coronary blood flow is stopped by inflating a proximal occlusion balloon and flushing the crystalloid solution at the rate of 0.5–1.0 ml/sec down the coronary artery.
- Non-occlusive technique. This is recently developed and does not need proximal balloon occlusion. During image acquisition the image wire pull back is performed at fast speed with simultaneous injection of contrast through the guiding catheter.
Safety of OCT
The energies used in OCT are low and do not cause functional or structural damage to the tissue. There are two reports on the safety of intracoronary OCT imaging.3,4 These reports have not shown any major adverse cardiac events, however, electrocardiogram (ECG) changes and ectopy were seen frequently during the pull back of the image catheter. All ECG changes and patient symptoms rapidly resolved at the end of the procedure.
Plaque characterisation
Ex vivo validation
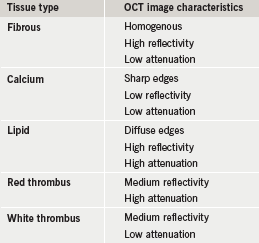
This was first performed in 2002 in 357 ex vivo post-mortem atherosclerotic segments from 90 cadavers.5 This study established OCT criteria for the various plaque components (shown in table 1). High sensitivity and specificity have been obtained by comparing with histology as a gold-standard reference, for the detection of both calcific and lipid-rich plaques (96% and 97%, and 90% and 92%, respectively).
In vivo characterisation
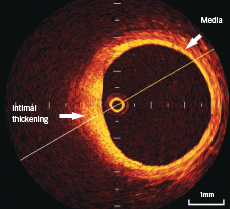
In normal vessels, the coronary artery wall appears as a three-layer structure in OCT images. The media is seen as a dark band delimited by internal elastic lamina (IEL) and external elastic lamina (EEL) (figure 1).
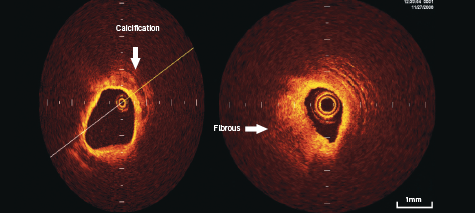
Calcifications within plaques are identified by the presence of well delineated, low back scattering heterogenous regions5-7 (figure 2).
Fibrous plaque consists of homogenous high back scattering areas5-7 (figure 2).
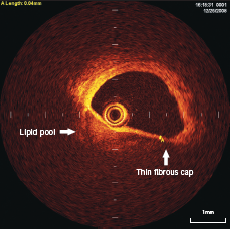
Necrotic lipid pools are less well delineated, and usually appear as diffusely bordered, signal poor regions with overlying signal-rich bands, corresponding to fibrous caps5-7 (figure 3).
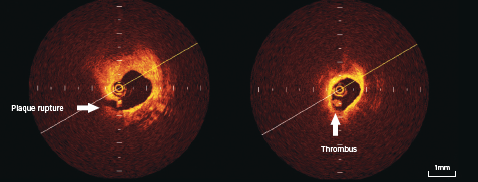
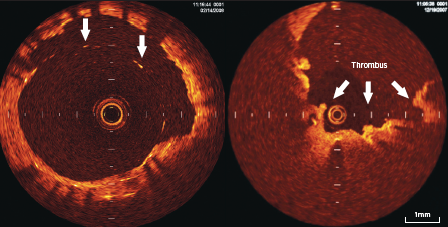
Thrombi are identified as masses protruding into the vessel lumen discontinuous from the surface of the vessel wall (figure 4).
Plaque ulceration or rupture can be detected by OCT as a ruptured fibrous cap that connects the lumen with the lipid pool. These may or may not be associated with thrombus (figure 4).
Thin cap fibro-atheroma (TCFA) is defined as plaques with lipid content in >2 quadrants on cross-sectional analysis and fibrous cap thickness of <65 µm (figure 3).
Potential clinical application of OCT
Plaque characteristics in various clinical syndromes
OCT has been shown to provide detailed in vivo characterisation of coronary plaque morphology. Jang et al.8 has evaluated this in patients with recent acute ST elevation myocardial infarction, acute coronary syndromes, and stable angina. Patients with an acute myocardial infarction (MI) and acute coronary syndromes had higher frequency of TCFA, as compared with patients with stable angina (72%, 50% and 20%, respectively; p=0.012). Similar results are shown with OCT analysis in other studies.6,9 This information leads to the better understanding of the mechanisms of coronary artery disease.
OCT can identify subclinical atherosclerotic lesions and the characteristics of high-risk plaque (TCFA or subclinical plaque rupture). This may have relevance to modulate the aggressiveness of medical therapeutic strategies for primary prevention. OCT has the potential for assessing the risk of MI, however, this needs to be proven and tested in future.
Guidance and optimisation of percutaneous coronary intervention
IVUS imaging is traditionally used to assess the outcome of coronary stenting but detailed information is often impossible to obtain because the metal struts impair image quality. Complete and proper approximation of the stent struts to the vessel wall could be better optimised by OCT due to its higher resolution. In 43 imaged stents, OCT consistently outperformed IVUS in the detection of dissection, tissue prolapse and incomplete stent apposition.10,11 These studies also show better understanding of balloon-induced dissection, intraluminal, thrombus, number of cuts made by cutting balloon, and tissue prolapse. The adequacy of stent deployment is a major predictor of re-stenosis and subacute stent thrombosis. Therefore, OCT could potentially pay a role in optimisation of coronary intervention.
OCT could be utilised in assessing angiographically normal and borderline coronary artery stenosis. OCT has got the potential to become a routine tool for guiding interventional procedure as this technology provides accurate lumen measurements, when compared with IVUS.
OCT is particularly helpful in assessment of angiographically hazy lesions, because identification of thrombus is far more superior with this technique as compared with IVUS.
Assessment of vascular healing following drug eluting stent
OCT can allow us to assess the impact of stenting to the vessel wall and can evaluate healing and remodelling of the vessel, which could be used as a surrogate end point for evaluating different stents and their platforms. There are some studies evaluating the neo-intimal coverage of the stent struts following drug eluting stents and bare metal stents. Chen et al.12 have shown higher incidence of unapposed (2% vs. 0%, p<0.001) and uncovered stent struts (13% vs. 0.3%) in sirolimus eluting stent (SES) group as compared with bare metal stent. Similar results were shown by Matsumato et al.,13 where 1.5% of the total stent struts were malapposed and without neointimal coverage in the SES group at six months. Takano et al.14 have shown higher incidence of stent inapposition and uncovered stent struts in patients with acute coronary syndrome (18% vs. 13%, p<0.001; 8% vs. 5%, p<0.005, respectively) as compared with stable angina patients following use of SES stents. However, there is no definite proven causal relationship established between malapposed and/or uncovered stent struts and incidence of late stent thrombosis.
Stent apposition and the neointimal coverage of the stent struts can be identified and monitored because of high resolution of the OCT (figure 5). This could potentially be helpful in follow-up of certain high-risk cases and also to optimise the results of stent implantation.
Limitations of OCT
The main limitation of OCT is the poor penetration power and inability to measure plaque burden where thickness exceeds 1.5 mm. In addition, the severity of plaques located at aorto-ostial locations is difficult to assess with the current stage of technology.
Conclusion
OCT is a rapidly evolving intracoronary imaging technique. It allows detailed structural analysis of superficial structures in the vessel wall, including coronary plaque characterisation and the vascular healing process following coronary stent implantation.
Conflict of interest
None declared.
Editors’ note
The next article in this series will be on computed tomography (CT). Part 1 in this series covered IUUS-derived virtual histology (Br J Cardiol 2010;17:129–32).
Key messages
- Angiographic assessment of coronary plaque is limited and does not provide the full story
- Optical coherence tomography (OCT) is a new technique similar to intravascular ultrasound (IVUS) that uses light rather than ultrasound to image structures
- OCT is around 10 times more powerful than IVUS when it comes to resolution of small structures
- OCT, like IVUS, can tell the difference between plaque types and is better at imaging thrombus
- It is hoped that future studies will show the benefit of performing OCT to improve stent deployment and patient outcomes from coronary intervention
References
1. Huang D, Swanson EA, Lin CP et al. Optical coherence tomography. Science 1991;254:1178–81.
2. Brezinski ME, Tearney GJ, Bouma BE et al. Optical coherence tomography for optical biopsy properties and demonstration of vascular pathology. Circulation 1996;93:1206–13.
3. Prati F, Cera M, Ramazzotti V et al. Safety and feasibility of a new non-occlusive technique for facilitated intracoronary optical coherence tomography (OCT) acquisition in various clinical and anatomical scenarios. Eurointerv 2007;3:365–70.
4. Yamaguvhi T, Terashima M, Akasaka T et al. Safety and feasibility of an intravascular optical coherence tomography image wire system in the clinical setting. Am J Cardiol 2008;101:562–7.
5. Yabushita H, Bouma BE, Houser SL et al. Characterisation of human atherosclerosis by optical coherence tomography. Circulation 2002;106:1640–5.
6. Jang IK, Bouma BE, Kang DH et al. Visualisation of coronary atherosclerotic plaques in patients using optical coherence tomography: comparison with intravascular ultrasound. J Am Coll Cardiol 2002;39:604–09.
7. Kubo T, Imanashi T, Takarda S et al. Assessment of culprit lesion morphology in acute myocardial infarction: ability of optical coherence tomography compared with intravascular ultrasound and coronary angioscopy. J Am Coll Cardiol 2007;50:933–9.
8. Jang IK, Tearney GJ, MacNeill B et al. In vivo characterisation of coronary atherosclerotic plaque by use of optical coherence tomography. Circulation 2005;111:1551–5.
9. Kume T, Akasaka T, Kawamato T et al. Assessment of coronary arterial plaque by optical coherence tomography. Am J Cardiol 2006;97:1172–5.
10. Diaz-Sandoval LJ. Optical coherence tomography as a tool for percutaneous interventions. Catheter Cardiovasc Interv 2005;65:492–6.
11. Bouma BE. Evaluation of intracoronary stenting by intravascular optical coherence tomography. Heart 2003;89:317–20.
12. Chen BX, Ma FY, Luo W et al. Neointimal coverage of bare metal and sirolimus eluting stents evaluated with optical coherence tomography. Heart 2008;94:566–70.
13. Matsumoto D, Shite J, Shinke T et al. Neointimal coverage of sirolimus eluting stents at 6 months follow up: evaluated by optical coherence tomography. Eur Heart J 2007;28:961–7.
14. Takano M, Inami S, Jang IK et al. Evaluation by optical coherence tomography of neointimal coverage of sirolimus eluting stent three months after implantation. Am J Cardiol 2007;99:1033–8.
