In this regular series ‘ECGs for the fainthearted’ Dr Heather Wetherell will be interpreting ECGs in a non-threatening and simple way. In this issue, we apply the knowledge gained so far to a situation that may be encountered in general practice.
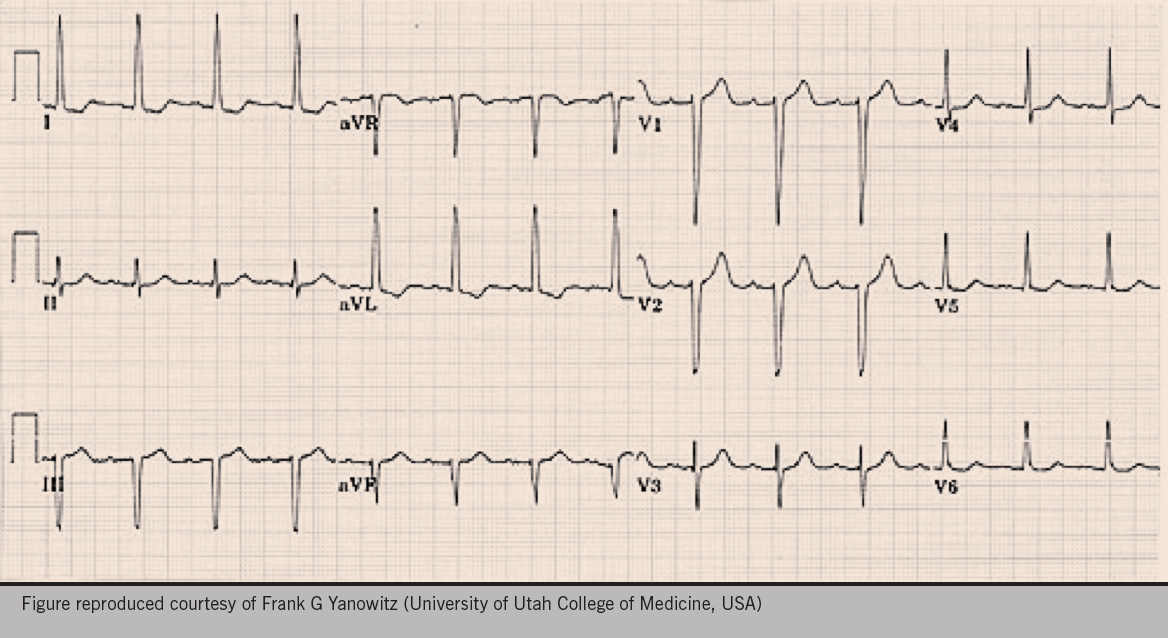
A 56-year-old woman attends for a well-woman blood pressure (BP) check. After three repeated measurements, a minute apart, her mean BP is 146/90 mmHg so the practice nurse decides to do an electrocardiogram (ECG), in accordance with the practice protocol. Figure 1 shows the ECG obtained.
What is your impression?
Does she need any further investigations?
Discussion
The main purpose of showing this ECG is to discuss the various voltage criteria for left ventricular hypertrophy (LVH).
Interestingly, there is no one universally agreed criteria for diagnosis of LVH by ECG. A few of the more commonly accepted ones are listed below.
This ECG is compatible with LVH in that it meets the voltage criteria for LVH, in leads I and aVL.
As no other criteria for LVH are met, it is often better to say “This ECG meets the voltage criteria for LVH”, rather than diagnose hypertrophy. Don’t forget, LVH can only be truly diagnosed on scanned images, such as an echocardiogram (echo).
On crude eye-balling, the axis on this ECG is around -30 degrees (-30 degrees falls within normal axis parameters). So whilst we have possible borderline left axis deviation (LAD), it’s probably not significant without a predominantly negative deflection in lead II as well.
The ECG also shows T-wave inversion in lead I and aVL. When seen together, a leftward axis and T wave inversion, would further support the diagnosis of LVH and strain (see below).
In accordance with latest National Institute for Health and Care Excellence (NICE) Hypertension Guidelines,1 you may want to offer this woman ambulatory BP monitoring (ABPM), or home BP monitoring (HBPM), for confirmation of diagnosis.
Her cardiovascular disease risk and any target organ damage should also be assessed. Urinalysis should be checked for proteinuria, and bloods for underlying causes, or evidence of target organ damage (including U&E’s, and glucose).
Regardless of whether she turns out to have stage 1 or stage 2 hypertension, on the basis of her ABPM,1 her LVH will certainly sway you towards a lower threshold to treat.
The clinic BP described for this patient is surprisingly low for someone with LVH and strain. In this situation, ABPM may demonstrate higher pressures than seen in clinic – known as ‘masked hypertension’ (a condition less recognised and less discussed than ‘white coat hypertension’) − and that would reinforce need for antihypertensive treatment. More commonly, significant obesity can add to the effects of hypertension so an assessment of weight and lifestyle is also appropriate.
LVH
LVH is defined as an increase in the mass of the left ventricle, which can be secondary to an increase in wall thickness, an increase in cavity size, or both. LVH as a consequence of hypertension usually presents with an increase in wall thickness, with or without an increase in cavity size. Accurate assessment thus requires imaging with either echo or, even better, cardiac magnetic resonance. Various ‘voltage criteria’ seen on ECG, however, can be suggestive of LVH.
The left ventricle is represented by leads v5 and v6.
So in LVH, we expect the ‘R’ waveforms to be enlarged/tall in these leads (conversely, we expect the ‘S’ waves to be deep in the right ventricular leads, that is V1 and V2).
Suggested voltage criteria for LVH include:
- The sum of the S wave in v1 or v2, PLUS the R wave in v5 or 6 ≥35 mm
or
- The sum of the deepest S wave + the tallest R wave >40 m
- Any single, R or S, wave in leads v1−v6 ≥45 mm
- The R wave in aVL ≥11 mm
- The R wave in lead I ≥12 mm
- The R wave in aVF ≥20 mm
The predictive value of the voltage criteria is cumulative. i.e. the more voltage criteria met, the greater the likelihood of LVH.
An ECG diagnosis of LVH is also more secure when there are associated ST/T wave changes rather than voltage criteria alone, as in the example above.
In the ECG shown in figure 1, the precordial leads do not meet the voltage criteria for LVH (arguably borderline, at 35 mm).
Many clinicians are aware of the R and S wave criteria in the precordial (chest) leads, but this can be dependent on body habitus. The chest leads placed on a tall, thin man, with little adipose tissue, are in close proximity to the heart so naturally, the waveform amplitude in the chest leads will be large. The limb leads, being less affected by body habitus, are often more reliable in these individuals.
To echo or not to echo?
One of the most common questions I’m asked by GP colleagues when they see an ECG which is reported as ‘LVH’ is “do they need to request an echo?”.
Generally speaking, unless it is likely to change your management plan, an echo is not required to confirm a diagnosis of LVH.
If a patient who is hypertensive is found to have LVH criteria on ECG, then an echo is only helpful if it will alter your threshold for treatment. If you plan to treat anyway, an echo is of dubious further value. (See 2011 NICE CG1271 for care management pathways).
As outlined above, voltage criteria for LVH in V1−V6 alone, in a tall thin person without other cause for concern, is not necessarily indicative of LVH and does not need an echo. Conversely, in an obese patient, the body fat between the ECG lead and the heart will result in a lower voltage in the precordial leads…and that may be the explanation in this case.
So remember − don’t just look at the chest leads!
Likewise, with an ECG suggestive of LVH in a normotensive person, an echo would only be indicated if:
a) body habitus didn’t explain the amplitude, or
b) there were other signs/symptoms of concern (possible HOCM [hypertrophic myopathy]? or aortic stenosis?).
In such cases, there would often be other suspicious features on the ECG (such as T wave changes) or symptoms of possible cardiac origin. Sinister underlying causes are less likely on the basis of simple voltage criteria for LVH alone.
Strain pattern
When LVH is associated with other pathology, such as hypertension or aortic stenosis, a ‘strain pattern’ is often seen:
- ST depression + flipped asymmetric T wave
- ST elevation + upright asymmetric T wave
- The strain pattern is greatest in the lead with the tallest/deepest QRS complex (seen in Lead I and aVL in the example above).
Simple isn’t it?
I hope this very simplified take on LVH helps clear up some of the conundrums around LVH, echo and hypertension – for GPs at least.
References
1. National Institute for Health and Care Excellence. Hypertension: clinical management of primary hypertension in adults. Clinical guideline 127. London: NICE, 2013. http://www.nice.org.uk/guidance/cg127
