Rapid rule-out of NSTEMI: clinical characteristics and outcome of patients with undetectable troponin

Br J Cardiol 2019;26:59–62doi:10.5837/bjc.2019.018 Leave a comment
Click any image to enlarge
Authors:

Studies have suggested that acute coronary syndrome (ACS) may be excluded by a single undetectable high-sensitivity troponin (hs-TnT) taken at least three hours after the onset of symptoms in patients with non-pleuritic chest pain whose electrocardiogram (ECG) is non-ischaemic.

During a six-month period between April and September 2015, we identified 147 consecutive patients with non-pleuritic chest pain and non-ischaemic ECG whose first hs-TnT was less than 5 ng/L at least three hours after the onset of symptoms. We used the Elecsys hs-TnT assay, which has a lower limit of detection of 5 ng/L and a 99th centile of <14 ng/L.

Sixty-seven of 147 (46%) patients were male. The average age of our cohort was 52 years, range 19–83 years. Coronary heart disease (CHD) was known to have been present in 24 (16%) before the index admission. Median length of hospital stay was 15.4 hours (mean 22.5 hours) with 86 (59%) patients spending more than 12 hours in hospital. We referred 60 (41%) patients to cardiology for further assessment, either during or after admission, in order to rule out unstable angina. No patient was readmitted with hs‑TnT positive ACS, one patient underwent elective revascularisation and no patient died during one year of follow-up. Only one patient was lost to follow-up.

In conclusion, patients with non-pleuritic chest pain, non-ischaemic ECG and undetectable hs-TnT at least three hours after the onset of symptoms have a low risk of hs-TnT positive ACS, revascularisation and death during one year of follow-up. Most such patients could safely be discharged from hospital after a few hours of observation, without the need for a second hs-TnT.

Introduction

Most patients presenting as an emergency with chest pain do not have myocardial infarction (MI),1 which must, nevertheless, be ruled out in order to reassure and discharge from hospital. High-sensitivity cardiac troponin T (hs-TnT) and troponin I (hs-TnI) have streamlined the assessment and management of chest pain, as a rapid rule out of MI is now possible, particularly if hs-TnT or hs-TnI are undetectable at presentation.2-8

Undetectable troponin cannot, however, be used to exclude unstable angina, which by definition is not associated with a troponin rise.9 It is for this reason that physicians and cardiologists may be reluctant to send patients home from the emergency department (ED) without further assessment. Previous studies have shown that the negative predictive value of an undetectable troponin is greater than 99% for MI and cardiac death up to 30 days,2,4-8 with only a few reporting cardiac outcomes up to one year.2,5

The purpose of our study was twofold: to determine the long-term risk of MI, coronary revascularisation and cardiac death by following a cohort of patients with undetectable hs-TnT and a non-ischaemic electrocardiogram (ECG) for a total of one year after their presentation with chest pain; and to explore the possibility that such patients might safely be discharged from hospital after a few hours’ observation.

Method

This was a retrospective study carried out in Dumfries and Galloway Royal Infirmary, a district general hospital covering a population of 147,000 in southwest Scotland. Hs-TnT was requested in 1,920 patients during a six-month period between April and September 2015 and was undetectable in 541 (28%). Using the algorithm shown in figure 1, we examined 308 electronic case sheets, which enabled us to exclude a further 67 patients who had no pain at presentation, 51 patients whose chest pain was pleuritic, 32 patients whose first hsTnT was ≤5 ng/L within three hours of the onset of symptoms, seven patients whose first hs-TnT was ≥5 ng/L and four patients with an ischaemic ECG at presentation. In this way, we were able to identify 147 consecutive patients with non-pleuritic chest pain and normal ECG whose first hs-TnT was less than 5 ng/L.

Youssef - Figure 1. Study flow chart
Figure 1. Study flow chart

For each patient, we reviewed the electronic case record for past history of coronary heart disease (CHD), i.e. previous acute coronary syndrome (ACS), coronary revascularisation, stable angina; time between onset of pain and blood draw for hs-TnT; time taken to discharge patient from hospital; whether patient was referred to cardiology for further assessment; and, finally, whether the patient was readmitted with ACS, revascularised or died within one year of their index admission. Linkage to the electronic case records at tertiary centres in Glasgow and Edinburgh, where angiography and revascularisation are undertaken, ensured that no admissions to these hospitals were missed. We considered the admission ECG to be ischaemic with any ST–T wave changes >1 mm, even if present on a previous ECG. In order to measure cardiac troponin we used the Elecsys hs-TnT assay, which has a lower limit of detection of 5 ng/L and a 99th centile of <14 ng/L.

Results

Sixty-seven of 147 (46%) patients with hs‑TnT <5 ng/L were male. The average age of our cohort was 52 years, range 19–83 years. CHD was known to have been present in 24 (16%) before the index admission. Thirty-two (22%) patients had hs-TnT measured once only; 108 (73%) had more than one undetectable hs-TnT; while seven (5%) had initial hs-TnT <5 ng/L and a subsequent hs‑TnT in the range 5–13 ng/L. Intermittent pain in 21 patients made it difficult to determine the precise time between symptom onset and blood draw, though in each of these cases the time between onset of first pain and blood draw was greater than three hours (table 1).

Youssef - Table 1. Baseline and follow-up data of 147 patients with undetectable high-sensitivity troponin T (hs-TnT) <5 ng/L
Table 1. Baseline and follow-up data of 147 patients with undetectable high-sensitivity troponin T (hs-TnT) <5 ng/L

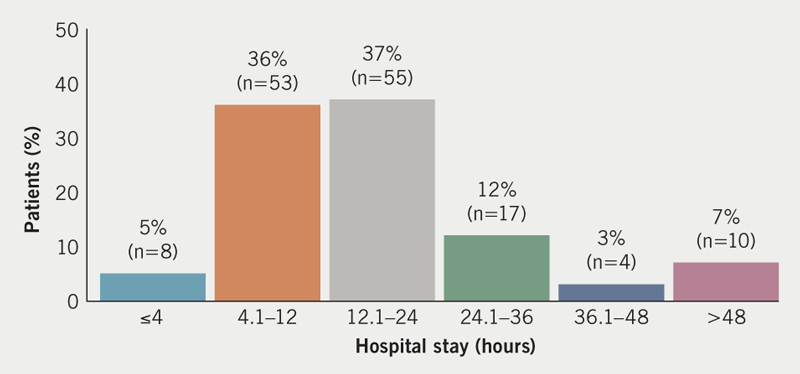
Median length of hospital stay was 15.4 hours (mean 22.5 hours) (figure 2). Only eight patients (5%) were discharged within four hours. Eighty-six (59%) and 31 (21%) patients, respectively, spent more than 12 and 24 hours in hospital. The reasons for a delay in discharge beyond 24 hours were as follows: awaiting consultant review (seven patients), awaiting cardiology team review (six), further inpatient investigations (nine), comorbidities (seven) and procedures (two).

Youssef - Figure 2. Duration of hospital stay
Figure 2. Duration of hospital stay

We referred 60 (41%) patients to cardiology for further assessment either during or after admission in order to rule out unstable angina. The outcome of these referrals (numbers in brackets) was as follows: cardiology clinic (33), exercise test (19), echocardiogram (11), 24-hour ECG monitor (eight), stress echo (seven), coronary angiogram (three), computed tomography (CT) coronary angiogram (two), cardiac magnetic resonance imaging (MRI) (two), thallium-perfusion scan (one). No patient was readmitted with hs-TnT positive ACS, one patient underwent elective revascularisation and no patient died during one year of follow-up. Only one patient, a holidaymaker from the Netherlands, was lost to follow-up.

The clinical details of the seven patients whose first troponin was undetectable and whose repeat was hs-TnT 5–13 ng/L are shown in table 2. Three gave a past history of CHD and five underwent further cardiac investigations, all of which were normal. None were readmitted with MI, required revascularisation or died during follow-up.

Youssef - Table 2. Clinical course and outcome of seven patients whose first hs-TnT was undetectable and whose second hs-TnT was 5–13 ng/L
Table 2. Clinical course and outcome of seven patients whose first hs-TnT was undetectable and whose second hs-TnT was 5–13 ng/L

Discussion

Our study of 147 patients admitted to a district general hospital in Scotland has shown that the combination of non-pleuritic chest pain with a non-ischaemic ECG and hs-TnT <5 ng/L carries a very low risk of troponin-positive ACS, coronary revascularisation or death during one year of follow-up. This is despite 16% of our patients having coronary disease at the time of presentation. Fifty-nine percent and 21% of patients, respectively, spent more than 12 and 24 hours in hospital. We referred 41% of patients to cardiology for further assessment. The fact that only one patient underwent coronary revascularisation during a year of follow-up suggests that we may have been overly cautious.

Zhelev and colleagues examined the accuracy of a single measurement of the Elecsys hs‑TnT assay in the diagnosis of acute MI in the ED.3 They showed that fewer than one in 100 acute MIs would be missed if 3 ng/L or 5 ng/L is used as the cut-off value. This was despite the fact that many of the studies in their meta-analysis included patients in whom the time from symptom onset to blood draw was less than three hours. Inclusion of such patients is likely to underestimate the sensitivity of the assay. They concluded that a single measurement of Elecsys hs‑TnT <5 ng/L can be used to rule out acute MI, except in patients who present less than three hours after symptom onset.3 This view has been supported by a meta-analysis,10 and endorsed by the European Society of Cardiology in their non-ST-elevation MI (NSTEMI) guideline, which states that a single Elecsys hs-TnT <5 ng/L rules out NSTEMI in patients presenting to the ED with chest pain and a normal ECG, except in those presenting very early, e.g. within one hour from chest pain onset, in whom a second cardiac troponin should be obtained at three hours due to the time dependency of troponin release.11

Similar findings have been reported for hs-TnI. The Chapman meta-analysis of 22,547 patients with suspected ACS in 19 cohorts found hs-TnI less than 5 ng/L in 49% of patients, and that this was associated with a negative predictive value (NPV) of 99.5% for the primary outcome of MI or cardiac death at 30 days.12 Only five per 1,000 patients with hs-TnI <5 ng/L went on to have MI or cardiac death at 30 days. NPVs were higher if patients presenting within two hours of symptom onset and those with ECG evidence of myocardial ischaemia were excluded from the analysis (NPV 99.6% if time of symptom onset to troponin sample >2 hours and NPV 99.7% if less than 2 mm ST depression in two consecutive leads and no new T-wave inversion). The use of lower thresholds than 5 ng/L did not improve diagnostic accuracy in this meta-analysis.12 Essentially similar results have been reported by the studies that contributed to that meta-analysis.2,4-6

The National Institute for Health and Care Excellence (NICE) recommends that high-sensitivity troponin measurements are interpreted together with the clinical presentation, time from onset of symptoms, the 12-lead ECG and, additionally, the pre-test probability of NSTEMI. NICE suggest a validated tool such as the thrombolysis in myocardial infarction (TIMI) score for this purpose.13 This advice has recently been validated in a pooled study of over 7,000 adults presenting to the ED with chest pain and a non-ischaemic ECG. NPVs for 30-day major adverse coronary events (MACE) were greater than 99% for all TIMI scores in the range 0–2, but were highest for TIMI score 0, which the authors felt would identify around 20% patients as low risk and suitable for early discharge.8 Others have shown that the combination of a limit of detection cut-off and a non-ischaemic ECG, in the absence of a clinical risk score, is as effective at ruling out MI, calling into question the added value of clinical risk stratification.2-7,10,12

We addressed the question of early discharge by examining duration of hospital stay for patients with non-ischaemic ECGs and undetectable troponin. Only 4% of these patients were discharged within four hours, suggesting either that clinicians were concerned they might still have unstable angina or that patients had other reasons for staying in hospital. In an attempt to determine the number of patients who might be suitable for early discharge, we found hs-TnT was undetectable in 541/1,920 (28%) patients in whom it was measured. Shah et al.2 and Parsonage et al.7 found undetectable hs-TnI in 649/3,340 (19%) and 943/3,128 (30%) of their patients, respectively. Others have estimated the proportion of patients safe for early discharge based on their troponin values and clinical risk scores,14,15 though we know of no study that has recorded exactly how long patients stayed in hospital and why. Clearly there is potential here for discharging more patients home sooner after documenting an undetectable troponin. Concerns about missing cases of unstable angina could be addressed by referring those who give a history of effort pain to rapid access chest pain clinics.

Our study has strengths and limitations. By reviewing all available electronic casenotes we were able to exclude patients who did not have chest pain and patients whose pain was pleuritic in nature. We were also confident of cardiovascular and other outcomes in all patients except one holidaymaker who was lost to follow-up. We recognise the following limitations. Our study was smaller than many others in this field and retrospective rather than prospective. Moreover, our results are specific for the Elecsys hs-TnT assay and cannot necessarily be extrapolated to other troponin assays, although the results of studies using the hs-TnI assay suggest that similar conclusions would have been drawn.

In conclusion, these data add to accumulating evidence that patients with non-pleuritic chest pain, non-ischaemic ECG and a single undetectable hs-TnT taken at least three hours after the onset of symptoms have a very good prognosis, and can safely be discharged from hospital after a few hours observation, without the need for a second hs-TnT.

Key messages

  • Acute coronary syndrome (ACS) may be excluded by a single undetectable high-sensitivity troponin (hs-TnT) taken at least three hours after the onset of symptoms in patients with non-pleuritic chest pain whose electrocardiogram (ECG) is non-ischaemic
  • Only 8/147 (5%) of our patients with undetectable hs-TnT were discharged from hospital within four hours
  • No patient was readmitted with hs-TnT positive ACS, one patient underwent elective revascularisation and no patient died during one year of follow-up
  • More patients could safely be discharged from hospital after a few hours observation without the need for a second hs-TnT

Conflicts of interest

None declared.

Funding statement

This research received no grant from any funding agency in the public, commercial or not-for-profit sectors.

Study approval

Ethical approval was not required as there were no patient identifiable data, in keeping with Scottish Health Boards’ policies.

References

1. Thygesen K, Alpert JS, Jaffe AS, Simoons ML, Chaitman BR, White HD. Third universal definition of myocardial infarction. Circulation 2012;126:2020–35. https://doi.org/10.1161/CIR.0b013e31826e1058

2. Shah ASV, Anand A, Sandoval Y et al. High sensitive troponin I at presentation in patients with suspected acute coronary syndrome: a cohort study. Lancet 2015;386:2481–8. https://doi.org/10.1016/S0140-6736(15)00391-8

3. Zhelev S, Hyde C, Youngman E et al. Diagnostic accuracy of single baseline measurement of Elecsys troponin T high sensitive assay for diagnosis of acute myocardial infarction in the emergency department: systematic review and meta-analysis. BMJ 2015;350:h15. https://doi.org/10.1136/bmj.h15

4. Chapman AR, Anand A, Boeddinghaus J et al. Comparison of the efficacy and safety of early rule out pathways for acute myocardial infarction. Circulation 2017;135:1586–96. https://doi.org/10.1161/CIRCULATIONAHA.116.025021

5. Neumann JT, Sorensen NA, Ojeda F et al. Immediate rule out of acute myocardial infarction using electrocardiogram and baseline high sensitive troponin I. Clin Chem 2017;63:394–402. https://doi.org/10.1373/clinchem.2016.262659

6. Sandoval Y, Smith SW, Love SA, Sexter A, Schulz K, Apple FS. Single high sensitivity cardiac troponin I to rule out myocardial infarction. Am J Med 2017;130:1076–83. https://doi.org/10.1016/j.amjmed.2017.02.032

7. Parsonage WA, Mueller C, Greenslade JH et al. Validation of NICE diagnostic guidance for rule out of myocardial infarction using high sensitive troponin tests. Heart 2016;102:1279–86. https://doi.org/10.1136/heartjnl-2016-309270

8. Carlton EW, Pickering JW, Greenslade J et al. Assessment of the 2016 National Institute for Health and Care Excellence high-sensitivity troponin rule-out strategy. Heart 2018;104:665–72. https://doi.org/10.1136/heartjnl-2017-311983

9. Anderson JL, Adams CD, Antnam EM et al. ACC/AHA 2007 guideline for the management of patients with unstable angina/non ST elevation myocardial infarction. A report of the American College of Cardiology/American Heart Association Task Force on Practice Guidelines. Circulation 2007;116:e14–e304. https://doi.org/10.1161/CIRCULATIONAHA.107.181940

10. Pickering JW, Than MP, Cullen L et al. Rapid rule-out of myocardial infarction with a single high sensitivity cardiac troponin T measurement below the limit of detection: a collaborative meta-analysis. Ann Intern Med 2017;166:715–24. https://doi.org/10.7326/M16-2562

11. Roffi M, Patrono C, Collet J-P et al. 2015 European Society of Cardiology guidelines for the management of acute coronary syndromes in patients presenting without persistent ST segment elevation. Eur Heart J 2016;37:267–315. https://doi.org/10.1093/eurheartj/ehv320

12. Chapman AR, Lee KK, McAllister DA et al. Association of high sensitivity troponin I concentration with cardiac outcomes in patients with suspected acute coronary syndrome. JAMA 2017;318:1913–24. https://doi.org/10.1001/jama.2017.17488

13. National Institute for Health and Care Excellence. Chest pain of recent onset. CG95. London: NICE, 2016. Available from: https://www.nice.org.uk/guidance/cg95

14. Carlton EW, Khattab A, Greaves K. Identifying patients suitable for discharge after a single presentation high sensitivity troponin result: a comparison of five established risk scores and two high sensitivity assays. Ann Emerg Med 2015;66:635–45. https://doi.org/10.1016/j.annemergmed.2015.07.006

15. Mokhtari A, Lindahl B, Schiopu A et al. A 0-hour/1-hour protocol for safe early discharge of chest pain patients. Acad Emerg Med 2017;24:983–92. https://doi.org/10.1111/acem.13224

Use of Frailsafe criteria to determine frailty syndrome in older persons admitted with decompensated HF

Br J Cardiol 2019;26:63–6doi:10.5837/bjc.2019.019 Leave a comment
Click any image to enlarge
Authors:

Frailsafe was developed by the British Geriatrics Society as clinical criteria to accurately identify patients at risk of frailty-associated harm on admission to hospital. There is no single validated tool for assessing frailty in heart failure on admission to hospital. The aim is to determine the prevalence of frailty-associated harm and the outcomes of older persons admitted to hospital with decompensated heart failure using Frailsafe screening criteria.

A retrospective cohort study of consecutive patients aged 75 years and over, admitted to hospital with decompensated heart failure within a six-month period was performed. Frailsafe screening criteria were applied to each patient retrospectively and data on length of stay, inpatient mortality, six-month mortality and readmission at six months was collected for all patients. The outcomes were analysed using univariate analysis comparing the patients ‘at risk of frailty-associated harm’ with those ‘not at risk’.

There were 103 patients identified as 75 years or older and admitted with a primary diagnosis of heart failure, 27% (28) were identified as at risk of frailty-associated harm. This cohort had a significantly longer length of stay (3.5 days, p=0.0496), worse six-month mortality (57% vs. 33%, p=0.0274) and more frequent emergency readmissions (2.04 vs. 0.97, p=0.0031).

In conclusion, prevalence of patients at risk of frailty-associated harm measured by Frailsafe in an older population admitted with decompensated heart failure was 27%. Such patients had a longer length of stay, and were at increased risk of readmission and mortality within the following six months. Future research should include analysis of confounding variables, such as comorbidity, in a larger population to aim to identify how to improve outcomes in this particularly high-risk group.

Introduction

Frailty is a distinctive health state, related to the ageing process, in which multiple body systems gradually lose their in-built reserves, and is related to poorer outcomes.1 There have been numerous tools developed to identify frailty,2-4 often these tools are complex and not suitable for identifying patients at the time of admission to hospital, requiring a comprehensive geriatric assessment to validate them. The British Geriatrics Society developed the Frailsafe5,6 checklist, which was piloted across 12 UK hospitals in 2014 as part of the Frailsafe collaborative. The tool used three screening indicators to identify patients at risk of frailty-associated harm, any person scoring positive on any of these indicators then triggered completion of the full checklist. The indicators are evidence of confusion, reduced mobility, or resident in a care home. Research into frailty has flourished, including its relationship with chronic diseases showing enhanced adverse outcomes.7-9

Heart failure is a long-term condition, defined as a common complex clinical syndrome of symptoms and signs caused by impairment of the heart’s action as a pump supporting the circulation.10 It is caused by structural or functional abnormalities of the heart.10 Heart failure, like frailty, leads to poorer outcomes, high mortality rates,11 and high admission rates to hospital. Heart failure accounts for approximately 5% of all emergency admissions and 2% of total NHS expenditure.11 With technologically advancing cardiology interventions and a generally ageing UK population,12 it is inevitable that the prevalence of heart failure will increase, as will the likelihood of frailty as a concomitant comorbid diagnosis.

Frailty in a heart failure population is common,13-15 and associated with worse outcomes including mortality,15-20 hospitalisations15,18,19,21 and quality of life.22‑24 Despite the development of numerous identification tools, there is no single validated tool for assessing frailty in a heart failure population.25 Prognostication is notoriously difficult in such long-term conditions; the Frailsafe screening criteria may be a useful indicator for predicting poor outcomes, enabling superior care planning that could potentially reduce inappropriate emergency admission and facilitate individualised, holistic care.

Aim

To identify the incidence of patients at risk of frailty-associated harm in an older heart failure population, whose primary reason for admission to hospital is decompensated heart failure, and to evaluate whether Frailsafe screening criteria can be used as a prognostic indicator.

Method

We conducted a retrospective observational cohort study identifying outcomes in an older heart failure population at risk of harm associated with frailty.

Patients were identified using local data from the National Heart Failure Audit (NHFA) database between September 2015 and March 2016 and extracted into an Excel spreadsheet. Entry into the NHFA database necessitates a primary coded discharge diagnosis for heart failure and data entry completed by the Heart Failure Team following heart failure specialist review. The diagnosis was quality assured via discussion at a multi-disciplinary team (MDT) meeting. All patients were reviewed by a specialist heart failure nurse or pharmacist, and heart failure treatment optimised during their inpatient stay.

Patients meeting the following criteria were included in the study: aged 75 years and over and admitted to hospital with a primary diagnosis of heart failure. Excluded were patients under the age of 75 years. Frailsafe screening criteria were retrospectively applied to patients to assess the risk of frailty-associated harm. Hospital electronic medical records were used to find if the patients scored for any of the three parameters: decreased mobility, increased confusion and care home resident. This was completed using the nursing documentation, where, on admission, all patients over the age of 65 years have a cognitive screen using a 4AT (4 A’s test) assessment; a screening instrument designed for rapid initial assessment of delirium and cognitive impairment. Patient’s mobility and any deviation from normal are recorded, and patient address was screened for nursing home residency. Data collected for each patient included: sex, age, type of heart failure, New York Heart Association (NYHA) status, presence of oedema and Frailsafe screening criteria. Outcome data on length of stay, number of readmissions to hospital in the six-month period post-discharge, inpatient mortality (during their admission) and six-month mortality were also collected. Data were anonymised following data collection.

Outcomes data were compared between the cohort ‘at risk’ versus ‘not at risk’ of frailty-associated harm groups and statistical differences between the two groups were analysed using Chi-squared and t-test.

Results

There were 103 primary diagnosis heart failure admissions aged over 75 years and included in the study, representing 57% of heart failure patients admitted to hospital within the data collection period. The characteristics of patients are presented in table 1. From the 103 patients identified, 27% (28) scored as ‘at risk of frailty-associated harm’ when using Frailsafe screening criteria.

Beezer - Table 1. Differences between heart failure patients aged ≥75 years ‘at risk of frailty-associated harm’ compared with those ‘not at risk’
Table 1. Differences between heart failure patients aged ≥75 years ‘at risk of frailty-associated harm’ compared with those ‘not at risk’

Patients ‘at risk’ of frailty-associated harm had a significantly longer length of stay than heart failure patients ‘not at risk’ (13.8 vs. 10.2 days, p=0.0496). Patients identified as ‘at risk’ had a significantly worse mortality at six months: 57% (n=16) vs. 33% (n=24), p=0.0274 (figure 1). The ‘at risk’ cohort of heart failure patients were also more likely to be readmitted to hospital within the six months following their initial admission with heart failure (p=0.0031).

Beezer - Figure 1. Mortality in heart failure patients ‘at risk’ of frailty-associated harm compared with those deemed ‘not at risk’
Figure 1. Mortality in heart failure patients ‘at risk’ of frailty-associated harm compared with those deemed ‘not at risk’

Discussion

Previous studies have shown the prevalence of frailty in a heart failure population to be between 18–56%.13,14,18,21,26 This study showed 27% of patients to be at risk of frailty-associated harm; of this cohort the majority (60%, n=17) were female and were on average older, this is in keeping with previous findings.15,17 The ‘at risk’ cohort had an average age of 84 years, older than that of the ’not at risk’ heart failure population by three years; aligning with the consensus that frailty is a syndrome of advancing age.1

This study also showed a longer length of stay for patients in the ‘at risk’ group of 3.5 days. Similar findings have previously been observed in frail cohorts with atrial fibrillation,27 and all frail patients on an acute medical unit.28 An extended stay for a frail cohort puts them at increased risk of acquired harm, such as reduced muscle mass, hospital-acquired infection and delirium. Increased length of stay in older people has been shown to worsen outcomes and increase long-term care needs.29 Although the increase in long-term care needs was not looked at in this study, the similarities between increased stay and poorer outcomes were, and correlate with results from previous studies.27,28

The higher incidence of mortality within the ‘at risk’ population highlights that applying Frailsafe criteria can predict poorer prognosis in a population with concurrent heart failure. Similarly, other studies using different frailty measures have shown similar increased mortality of frail heart failure patients at 30 days1 and one year.15,17

Both six-month mortality and readmission rates within six months were worse, despite the same package of care being available to both groups during their inpatient stay, as follows: all patients received a heart failure specialist review and were discussed at a heart failure MDT meeting; had heart failure medications optimised as far as possible during their inpatient stay, within accepted parameters for blood pressure, heart rate, renal function and adverse drug reactions; and a clinical management plan generated for ongoing care, all of which are recommended by national guidelines10 for good quality care and have shown improved mortality11 in a general heart failure population.

No significant differences were seen in prevalence of reduced versus preserved ejection fraction symptoms, including oedema and NYHA class, when comparing the ‘at risk’ to the ‘not at risk’ groups, respectively. However, there were numerical differences in levels of oedema; 93% versus 79% in the ‘at risk’ compared with the ‘not at risk’ groups. The ‘at risk’ group also received numerically less disease-modifiable treatments. Unfortunately, loop diuretics were not looked at as part of this study.

Strengths and limitations

This is the first study to look at the use of the Frailsafe screening criteria in a heart failure cohort and its results are hypothesis generating. This study is limited by a relatively small population, and there is the potential of many unknown confounding variables between the two groups, including the impact of multiple comorbidities and the differences in treatment and symptoms between the groups.

Conclusion

Frailsafe screening criteria have been shown to identify a group of older heart failure patients at risk of frailty-associated harm who, following admission to hospital, have a longer length of stay and poor prognosis in this small pilot study. Further larger scale work should describe and analyse the presence of comorbidities and the differences in treatment tolerability and up-titration, and their impact on outcomes, including prognosis and quality of life, utilising regression analysis to take into account all confounding variables. Other potential differences between frail and non-frail patients, which may impact on outcomes warrant further investigation, including the mode by, and stage at, which patients are diagnosed with heart failure and the care received by both groups at each stage of the syndrome. More research and funding are vital to develop interventions appropriate for this ‘high-risk’ population.

Conflicts of interest

None declared.

Funding

No financial funding was sourced to support this work. The original Frailsafe collaboration was supported by a Health Foundation ‘Closing the Gap in Patient Safety’ award. The financial sponsors have played no role in this piece of work. The views expressed in this publication are solely those of the authors.

Acknowledgements

Thanks are due to the Frailsafe Collaborative for constructive comments on a previous draft of this article and The Health Foundation for their support.

Study approval

The Hospital research and audit committee did not deem ethical approval necessary for this retrospective cohort analysis.

Key messages

  • The prevalence of frailty, as assessed by Frailsafe criteria, in older patients admitted with decompensated heart failure was established
  • 27% of patients were deemed at risk of frailty-associated harm by Frailsafe criteria
  • Length of stay, six-month mortality and number of readmissions in six months was greater in frail heart failure patients
  • Frailsafe criteria identify older heart failure patients who subsequently have adverse outcomes

References

1. Turner G, Clegg A, Youde J. Fit for frailty. Consensus best practice guidance for the care of older people living with frailty in community and outpatient settings. London: British Geriatrics Society, 2014. Available from: https://www.bgs.org.uk/sites/default/files/content/resources/files/2018-05-23/fff_full.pdf

2. Rockwood K, Song X, MacKnight C et al. A global clinical measure of fitness and frailty. Can Med Assoc J 2005;173:489–95. https://doi.org/10.1503/cmaj.050051

3. Rolfson DB, Majumdar SR, Tsuyuki RT, Tahir A, Rockwood K. Validity and reliability of the Edmonton Frail Scale. Age Ageing 2006;35:526–9. https://doi.org/10.1093/ageing/afl041

4. Bieniek J, Wilczyński K, Szewieczek J. Fried frailty phenotype assessment components as applied to geriatric inpatients. Clin Interv Aging 2016;11:453–9. https://doi.org/10.2147/CIA.S101369

5. Sheffield Teaching Hospitals NHS trust on behalf of the British Geriatrics Society. Frailsafe: a safety checklist for frail older patients entering acute hospital care. London: The Health Foundation. Available from: https://www.health.org.uk/programmes/closing-gap-patient-safety/projects/frailsafe-safety-checklist-frail-older-patients

6. Papoutsi C, Poots A, Clements J, Wyrko Z, Offord N, Reed JE. Improving patient safety for older people in acute admissions: implementation of the Frailsafe checklist in 12 hospitals across the UK. Age Ageing 2018;47:311–17. https://doi.org/10.1093/ageing/afx194

7. Weiss CO. Frailty and chronic disease in older adults. Clin Geriatr Med 2011;27:39–52. https://doi.org/10.1016/j.cger.2010.08.003

8. Galizia G, Cacciatore F, Testa G et al. Role of clinical frailty on long-term mortality of elderly subjects with and without chronic obstructive pulmonary disease. Aging Clin Exp Res 2011;23:118. https://doi.org/10.1007/BF03351076

9. Afilalo J, Karunananthan S, Eisenberg MJ, Alexander KP, Bergman H. Role of frailty in patients with cardiovascular disease. Am J Cardiol 2009;103:1616–21. https://doi.org/10.1016/j.amjcard.2009.01.375

10. National Institute for Health and Care Excellence. Chronic heart failure in adults: diagnosis and management. NG106. London: NICE, 2018. Available from: https://www.nice.org.uk/guidance/ng106

11. National Institute for Cardiovascular Outcomes Research. National heart failure audit April 2014–March 2015. London: University College London, 2016. Available from: https://www.hqip.org.uk/resource/national-heart-failure-audit-2014-2015/

12. McDonagh TA, Blue L, Clark AL et al. European Society of Cardiology Heart Failure Association standards for delivering heart failure care. Eur J Heart Fail 2011;13:235–41. https://doi.org/10.1093/eurjhf/hfq221

13. Denfeld QE, Winters-Stone K, Mudd JO, Gelow JM, Kurdi S, Lee CS. The prevalence of frailty in heart failure: a systematic review and meta-analysis. Int J Cardiol 2017;236:283–9. https://doi.org/10.1016/j.ijcard.2017.01.153

14. Jha SR, Ha HS, Hickman LD et al. Frailty in advanced heart failure: a systematic review. Heart Fail Rev 2015;20:553–60. https://doi.org/10.1007/s10741-015-9493-8

15. Vidan MT, Blaya-Novakova V, Sanchez E, Ortiz J, Serra-Rexach JA, Bueno H. Prevalence and prognostic impact of frailty and its components in non-dependent elderly patients with heart failure. Eur J Heart Fail 2016;8:869–75. https://doi.org/10.1002/ejhf.518

16. Martín-Sánchez FJ, Rodríguez-Adrada E, Vidan MT et al. Impact of frailty and disability on 30-day mortality in older patients with acute heart failure. Am J Cardiol 2017;120:1151–7. https://doi.org/10.1016/j.amjcard.2017.06.059

17. Cacciatore F, Abete P, Mazzella F et al. Frailty predicts long-term mortality in elderly subjects with chronic heart failure. Eur J Clin Invest 2005;35:723–30. https://doi.org/10.1111/j.1365-2362.2005.01572.x

18. Martín-Sánchez FJ, Rodríguez-Adrada E, Mueller C et al. The effect of frailty on 30-day mortality risk in older patients with acute heart failure attended in the emergency department. Acad Emerg Med 2017;24:298–307. https://doi.org/10.1016/j.amjcard.2017.06.059

19. Rodríguez-Pascual C, Paredes-Galán E, Ferrero-Martínez AI et al. The frailty syndrome is associated with adverse health outcomes in very old patients with stable heart failure: a prospective study in six Spanish hospitals. Int J Cardiol 2017;236:296–303. https://doi.org/10.1016/j.ijcard.2017.02.016

20. Madan SA, Fida N, Barman P et al. Frailty assessment in advanced heart failure. J Cardiac Fail 2016;22:840–4. https://doi.org/10.1016/j.cardfail.2016.02.003

21. McNallan SM, Singh M, Chamberlain AM et al. Frailty and healthcare utilization among patients with heart failure in the community. JACC Heart Fail 2013;1:135–41. https://doi.org/10.1016/j.jchf.2013.01.002

22. Butts B, Gary R. Coexisting frailty, cognitive Impairment, and heart failure: implications for clinical care. J Clin Outcomes Manag 2015;22:38–46. Available from: https://www.ncbi.nlm.nih.gov/pmc/articles/PMC4650868/

23. Buck HG, Riegel B. The impact of frailty on health related quality of life in heart failure. Eur J Cardiovasc Nurs 2011;10:159–66. https://doi.org/10.1016/j.ejcnurse.2010.06.001

24. Denfeld QE, Winters-Stone K, Mudd JO, Hiatt SO, Lee CS. Identifying a relationship between physical frailty and heart failure symptoms. J Cardiovasc Nurs 2018;33:E1–E7. https://doi.org/10.1097/JCN.0000000000000408

25. McDonagh J, Martin L, Ferguson C, Macdonald PS, Davidson PM, Newton P. Frailty assessment instruments in heart failure: a systematic review. Eur J Cardiovasc Nurs 2018;17:23–35. https://doi.org/10.1177/1474515117708888

26. Reeves GR, Whellan DJ, Patel MJ et al. Comparison of frequency of frailty and severely impaired physical function in patients ≥60 years hospitalized with acute decompensated heart failure versus chronic stable heart failure with reduced and preserved left ventricular ejection fraction. Am J Cardiol 2016;117:1953–8. https://doi.org/10.1016/j.amjcard.2016.03.046

27. Nguyen TN, Cumming RG, Hilmer SN. The impact of frailty on mortality, length of stay and re-hospitalisation in older patients with atrial fibrillation. Heart Lung Circ 2016;25:551–7. https://doi.org/10.1016/j.hlc.2015.12.002

28. Juma S, Taabazuing M, Montero-Odasso M. Clinical frailty scale in an acute medicine unit: a simple tool that predicts length of stay. Can Geriatr J 2016;19:34–9. https://doi.org/10.5770/cgj.19.196

29. National Audit Office. Discharging older patients from hospital. London: Department of Health, 2016. Available from: https://www.nao.org.uk/report/discharging-older-patients-from-hospital/

Incidence and epidemiology of infective endocarditis from 2010 to 2017 in a rural UK hospital

Br J Cardiol 2019;26:67–8doi:10.5837/bjc.2019.020 Leave a comment
Click any image to enlarge
Authors:

Infective endocarditis (IE) is an increasingly common disease associated with significant morbidity and mortality. It is known that the incidence of IE has been rising globally, but the reasons for this rise are not fully understood. This study sought to investigate the epidemiology of IE in a UK population, with a review of mortality outcomes based on current clinical practice.

Introduction

Infective endocarditis (IE) is a relatively rare disease; however, it is becoming increasingly common and is associated with significant morbidity and mortality.1 A recent meta-analysis has revealed that the epidemiology of IE has evolved over the last five decades,2 with significant global variation. Several large epidemiological studies show that the incidence of IE is increasing, particularly in male and elderly patients.3-5 There have also been changes in the microbiology of IE with staphylococci overtaking streptococci as the most frequent causative organism.6 There are few recent studies describing the incidence or epidemiology of IE in the UK. We carried out a retrospective analysis of IE cases from 2010 to 2017 in a rural district general hospital.

Method

We conducted a retrospective analysis of the medical records of patients who were treated for IE at a rural district general hospital in Herefordshire between 1 January 2010 and 31 December 2017. All patients aged over 18 years, who were diagnosed with IE, were included in the study.

Demographic, clinical, microbiological and clinical outcome data were gathered from patients’ medical records. Incidence rates were calculated as the number of IE cases per 100,000 person-years, with the assumption that the entire adult population of Herefordshire was at risk. The denominators of age- and sex-specific person-years were derived from Herefordshire census data.

A multi-variable Poisson regression model was used to determine if there was a significant temporal trend in the incidence of IE over the study period. Age, sex and year were entered into the model as explanatory variables. A p value of less than 0.05 was considered significant.

Results

Forty-eight cases of IE were identified over the study period. These cases represented 46 patients, two of whom were treated for IE twice during the study period. Forty cases were from patients resident in Herefordshire. The remaining eight cases were patients resident in counties bordering Herefordshire.

The total age- and sex-adjusted incidence rate of IE over the study period was 3.4 cases per 100,000 person-years. Poisson regression showed a statistically significant increase in the annual incidence of IE in Herefordshire between 2010 and 2017 (95% confidence intervals [CI] 1.011 to 1.416, p=0.036) (figure 1).

Hughes - Figure 1. Incidence of infective endocarditis (IE) in people aged 18 years and over in the county of Herefordshire between 2010 and 2017 (n=40). The total population of Herefordshire is used as the denominator. Poisson regression showed a statistically significant increase in the incidence of IE over the study period (p=0.036)
Figure 1. Incidence of infective endocarditis (IE) in people aged 18 years and over in the county of Herefordshire between 2010 and 2017 (n=40). The total population of Herefordshire is used as the denominator. Poisson regression showed a statistically significant increase in the incidence of IE over the study period (p=0.036)

IE was more common in males (62.5%) than females (37.5%). Native valve disease was the most common predisposing risk factor for IE (43.8% of patients). Thirty-one percent of patients had a prosthetic valve (n=15). Other predisposing conditions included congenital heart disease (14.6%), previous IE (12.5%), presence of an implantable cardiac device (12.5%), intravenous drug use (8.3%) and hypertrophic obstructive cardiomyopathy (HOCM) (2.1%).

Streptococcus spp. were isolated from blood cultures in 17 cases (35.4%) followed by Staphylococcus spp. (16 cases, 33.3%), Enterococcus (three cases, 6.3%), Pseudomonas aeruginosa (one case, 2.1%), Micrococcus spp. (one case, 2.1%) and 10 cases were culture negative (20.8%). Of the staphylococci, 12 cases were caused by S. aureus (25.0%), of which one case was methicillin-resistant. Four cases were caused by coagulase-negative Staphylococcus. Streptococcal species were the cause of 46% of healthcare-associated infections and 32% of community-acquired infections.

Thirty-three cases had native valve IE (68.7%) and 15 had prosthetic valve IE (31.3%). Infections were most often acquired in the community (72.9%, n=35). Twenty-seven percent of infections were healthcare-associated (n=13) and there were no nosocomial infections.

Five of the 48 cases developed a para-valvular abscess (10.4%) and embolic events were reported in five cases (10.4%). Nine of the 48 cases required valve surgery during their acute admission for IE (18.8%). Two of the nine patients died within six months of having surgery. There were four in-hospital deaths (8.3%) and six-month mortality was 16.7% (n=8).

Discussion

This study found that the incidence of IE has significantly increased in the adult population of Herefordshire between 2010 and 2017. This is in keeping with a trend of increasing incidence reported elsewhere in the UK,5 and worldwide.2,4,7

There are likely to be multiple factors influencing the rising incidence of IE including an increasingly elderly population,8 with increasing numbers of comorbidities, leading to increased contact with the healthcare system and increasing numbers of intra-cardiac devices.2,9

Staphylococcal IE has been typically associated with healthcare associated IE,9,10 however, we found streptococcal species to be the predominant cause of healthcare-associated IE. This may be partly explained by Herefordshire being a predominantly rural population with a low rate of intravenous drug use. There may be other reasons for this finding, but the cohort is small and larger studies are needed to evaluate this further.

Key messages

  • Infective endocarditis (IE) is an increasingly common disease associated with significant morbidity and mortality. There are no studies, of which we are aware, that describe morbidity or mortality outcomes associated with IE in the UK
  • This study shows that the incidence of IE has significantly increased in the UK population studied from 2010 to 2017, in keeping with global trends. Streptococci were the predominant cause of healthcare-associated IE, in contrast to other areas of the world where staphylococci are the main cause
  • There was no significant additional mortality associated with prosthetic valve endocarditis (PVE) or repeat infection with IE, both of which are associated with worse treatment outcomes
  • In this study, patients treated with one antibiotic had no significant additional mortality compared with patient’s treated with more than one antibiotic. This finding may reassure clinicians and help to reduce over-prescribing of antibiotics in the treatment of IE amenable to single antibiotic therapy

Conflicts of interest

None declared.

Funding

All authors are employed by the UK National Health Service. The views expressed in this publication are those of the authors and not necessarily those of the UK National Health Service.

Study approval

The study was approved by the Clinical Audit Department at Wye Valley Trust. Formal ethics approval was not required.

References

1. Cahill TJ, Prendergast BD. Infective endocarditis. Lancet 2016;387:882–93. https://doi.org/10.1016/S0140-6736(15)00067-7

2. Slipczuk L, Codolosa JN, Davila CD et al. Infective endocarditis epidemiology over five decades: a systematic review. PLoS One 2013;8:1–17. https://doi.org/10.1371/journal.pone.0082665

3. Bor DH, Woolhandler S, Nardin R, Brusch J, Himmelstein DU. Infective endocarditis in the U.S., 1998–2009: a nationwide study. PLoS One 2013;8:e60033. https://doi.org/10.1371/journal.pone.0060033

4. Pant S, Patel NJ, Deshmukh A et al. Trends in infective endocarditis incidence, microbiology, and valve replacement in the United States from 2000 to 2011. J Am Coll Cardiol 2015;65:2070–6. https://doi.org/10.1016/j.jacc.2015.03.518

5. Dayer MJ, Jones S, Prendergast B, Baddour LM, Lockhart PB, Thornhill MH. An increase in the incidence of infective endocarditis in England since 2008: a secular trend interrupted time series analysis. Lancet 2015;385:1219–28. https://doi.org/10.1016/S0140-6736(14)62007-9

6. Selton-Suty C, Célard M, Le Moing V et al.; AEPEI Study Group. Preeminence of staphylococcus aureus in infective endocarditis: a 1-year population-based survey. Clin Infect Dis 2012;54:1230–9. https://doi.org/10.1093/cid/cis199

7. DeSimone DC, Tleyjeh IM, Correa de Sa DD et al. Temporal trends in infective endocarditis epidemiology from 2007 to 2013 in Olmsted County, MN. Am Heart J 2015;170:830–6. https://doi.org/10.1016/j.ahj.2015.07.007

8. Durante-Mangoni E, Bradley S, Selton-Suty C et al. Current features of infective endocarditis in elderly patients: results of the International Collaboration on Endocarditis Prospective Cohort study. Arch Intern Med 2008;168:2095–103. https://doi.org/10.1001/archinte.168.19.2095

9. Benito N, Miró JM, de Lazzari E et al. Health care-associated native valve endocarditis: importance of non-nosocomial acquisition. Ann Intern Med 2009;150:586–94. https://doi.org/10.7326/0003-4819-150-9-200905050-00004

10. Athan E, Chu VH, Tattevin P et al. Clinical characteristics and outcome of infective endocarditis involving implantable cardiac devices. JAMA 2012;307:1727–35. https://doi.org/10.1001/jama.2012.497

What are we?* The BMI should accept terms for a graceful retirement
*with apologies to The Bunyip of Berkeley’s Creek

Br J Cardiol 2019;26:69–71doi:10.5837/bjc.2019.021 Leave a comment
Click any image to enlarge
Authors:

Body mass index (BMI) was first proposed in 1835 as a way to standardise body composition assessment for people of different heights, at a time when malnutrition was the main public health concern. BMI has been considered appropriately as a part of nutritional assessment in populations. It is not, however, a useful tool for assessment of individuals because there is so much individual variability in body composition and in its impact on health outcomes. Similarly, high BMI does not distinguish between excess body fat (bad for health) and large muscle mass (good). In contrast, we propose that individuals need to be assessed using clinical criteria, monitored over time to trigger different interventions. A diagnosis of obesity should be based on estimates of body fat (BMI, now being replaced by percentage body fat) at a particular age, and a clinical staging system.

Introduction

It is time to adopt recent (and even some 20th century) evidence for obesity and weight management. Some aspects of current practice, both clinical and epidemiological, are still largely lodged in the mid-19th century.

The body mass index (BMI) was first proposed in 1835 by Adolphe Quetelet, a Belgian mathematician, as a way to standardise body composition assessment for people of different heights. His work was published in the English language a few years later.1 At that time, few people, mostly affluent, had a BMI above 30 kg/m2, and far fewer had type 2 diabetes. The main public health concern was malnutrition, and BMI <18.5 kg/m2 does commonly point to undernutrition. Our needs for 21st-century public health and clinical practice are very different, much more focused on obesity and the secondary chronic metabolic diseases. However, still the main (and often sole) information provided in national surveys is BMI,2,3 and sometimes BMI is used and recommended inappropriately in clinical settings. For example, in England, the National Institute for Health and Care Excellence (NICE) provides this guidance for assessing individual patients: “Identify people eligible for referral to lifestyle weight management services by measuring their body mass index (BMI). Also measure waist circumference for those with a BMI less than 35 kg/m2.”4 Similarly, the Scottish government’s obesity strategy: “Adults can be classified into (conventional) BMI groups.”5

There are two recurring problems here. First, while BMI has been considered, appropriately, as a part of nutritional assessment in populations,6 it is not useful to assess individuals because there is so much individual variability in body composition and in its impact on health outcomes. A BMI of 28 or 30 kg/m2 can be perfectly normal for a power sportsman, such as a rugby player in training or a heavyweight boxer, but in other people, type 2 diabetes may develop when BMI rises from 22 to 24, because extra fat is being deposited in the liver and other ectopic sites.

Second, high BMI does not distinguish between excess body fat (bad for health) and large muscle mass (good). If you know peoples’ age, sex, height, weight, waist and hip circumferences, you can estimate body fat7 and muscle mass,8 separately, using well-validated published equations. They have opposite associations with major metabolic outcomes – type 2 diabetes9 and hypertension.10 That is much more useful than BMI, which lumps together these two very different tissue components. Assessing body fat and muscle mass separately is of particular importance to identify the worrying trends towards sarcopenia, with all the health risks from frailty, especially when accompanied by obesity, and in older people.

To illustrate the misleading use of BMI, we analysed 24 lineal heavyweight boxing champions in the past century, the first of whom was inaugurated by the Ring magazine in 1919.11 Their mean (± standard deviation [SD]) age was 26.7 ± 3.8 years, BMI 26.7 ± 1.8 kg/m2, and waist circumference (WC) 85.5 ± 3.2 cm (table 1). We found that the majority (75%) had a BMI over 25 kg/m2 while only one (4.2%) had a WC above “Action Level 1” (≥94 cm) (figure 1). The years in which the champions first won their title increased linearly with BMI (r=0.413, p=0.045) but not with waist circumference (r=0.015, p=0.945). These results indicate that among these elite sportsmen, there is a secular change in BMI which mirrors the changes among general populations, but does not necessarily indicate that they are getting fatter, since the size of their waist circumferences remains constantly unchanged. Increasing numbers of healthy fit individuals, who train regularly in power exercise or sports, are likely to be misclassified as overweight or even obese in health surveys.

Lean - Table 1. Characteristics of the 24 consecutive lineal heavyweight boxing champions
Table 1. Characteristics of the 24 consecutive lineal heavyweight boxing champions
Lean - Figure 1. Plots showing the relationships of body mass index (BMI) and waist circumference against years since the first championship of the 24 consecutive lineal heavyweight boxing champions. Dashed lines indicate BMI at 25 kg/m2 (above) and waist circumference at 94 cm (below)
Figure 1. Plots showing the relationships of body mass index (BMI) and waist circumference against years since the first championship of the 24 consecutive lineal heavyweight boxing champions. Dashed lines indicate BMI at 25 kg/m2 (above) and waist circumference at 94 cm (below)

There is, therefore, a good reason for national surveys, which include simple measurements, now to report average body fat and muscle mass in population groups, not just BMI. Waist circumference ‘Action levels’ were introduced for health promotion as an alternative to BMI, because waist size provided a more reliable guide to health risks and outcomes than BMI (recognising that waist measurement becomes unreliable with severe obesity, by which stage health risks are inevitably high). People can identify with their waist size, which relates closely to clothing size,12 so it can be helpful to monitor the waist circumference of individuals over time, as well as weight. Waist also has value in epidemiology, for estimating body fat and muscle mass using the published equations.7,8

There are no simple diagnostic criteria for ‘obesity’ or ‘overweight’ in individuals. These value-judgement terms have become synonymous with BMI cut-offs in epidemiology, but obesity is not a certain BMI level. Obesity is a disease process of excess body fat accumulation. A range of genetic, epigenetic and neuroendocrine factors contribute, and if they have causal roles in generating positive energy balance, they must be present while the weight and BMI are still low. That process of obesity generates multiple organ-specific pathological consequences, which can develop at different rates, and at different ages, with varying degrees of ultimate sickness and disability.13 So for clinical purposes, individuals need to be assessed using clinical criteria, monitored over time to trigger different interventions. The diagnosis must, therefore, be based on estimates of body fat (BMI, now being replaced by per cent body fat) at a particular age, and a clinical staging system such as the Edmonton Obesity Staging System14 or the King’s Hospital staging system15.

Key messages

  • Body mass index (BMI) was first introduced to standardise body composition assessment for people of different heights
  • BMI is not useful to assess individuals because there is so much individual variability in body composition and in its impact on health outcomes
  • Diagnosis of obesity must now be based on estimates of body fat (BMI, now being replaced by percentage body fat) at a particular age, and a clinical staging system

Conflicts of interest

None declared.

Funding

None.

References

1. Quetelet A. A treatise on man and the development of his faculties. Originally published in 1842. Reprinted in 1968 by Burt Franklin, New York. Also available from: Obes Res 1994;2:72–85. https://doi.org/10.1002/j.1550-8528.1994.tb00047.x

2. NHS Digital. Health Survey for England, 2016. London: National Statistics, 2017. Available from: https://digital.nhs.uk/data-and-information/publications/statistical/health-survey-for-england/health-survey-for-england-2016 [accessed January 2019].

3. Eurostat statistics explained. Overweight and obesity – BMI statistics, 2017. Available at: https://ec.europa.eu/eurostat/statistics-explained/index.php/Overweight_and_obesity_-_BMI_statistics [accessed January 2019].

4. National Institute for Health and Care Excellence. Managing overweight and obesity in adults – lifestyle weight management services. NICE public health guidance 53. London: NICE, May 2014. Available from: https://www.nice.org.uk/guidance/ph53 [accessed January 2019].

5. Scottish Government. A healthier future – Scotland’s diet: a healthy weight delivery plan. Edinburgh: Scottish Government, 2018. Available from: https://www.gov.scot/Publications/2018/07/8833/355982

6. World Health Organization (WHO). Body mass index – BMI. Available at: www.euro.who.int/en/health-topics/disease-prevention/nutrition/a-healthy-lifestyle/body-mass-index-bmi [accessed January 2019].

7. Lean ME, Han TS, Deurenberg P. Predicting body composition by densitometry from simple anthropometric measurements. Am J Clin Nutr 1996;63:4–14. https://doi.org/10.1093/ajcn/63.1.4

8. Al-Gindan YY, Hankey C, Govan L, Gallagher D, Heymsfield SB, Lean ME. Derivation and validation of simple equations to predict total muscle mass from simple anthropometric and demographic data. Am J Clin Nutr 2014;100:1041–51. https://doi.org/10.3945/ajcn.113.070466

9. Han TS, Al-Gindan Y, Hankey CR, Lean MEJ. Associations of BMI, waist circumference, body fat and skeletal muscle with type 2 diabetes in adults. Acta Diabetol 2019;in press. https://doi.org/10.1007/s00592-019-01328-3

10. Han TS, Al-Gindan Y, Hankey CR, Govan L, Lean MEJ. Associations of BMI, waist circumference, body fat and skeletal muscle with hypertension in adults. J Clin Hypertens (Greenwich) 2019;21:230–8. https://doi.org/10.1111/jch.13456

11. Wikipedia. List of The Ring world champions. Available at: https://en.wikipedia.org/wiki/List_of_The_Ring_world_champions [accessed January 2019].

12. Han TS, Gates E, Truscott E, Lean ME. Clothing size as an indicator of adiposity, ischaemic heart disease and cardiovascular risks. J Hum Nutr Diet 2005;18:423–30. https://doi.org/10.1111/j.1365-277X.2005.00646.x

13. Scottish Intercollegiate Guidelines Network. Management of obesity. Edinburgh: SIGN, 2010. Available from: https://www.sign.ac.uk/assets/sign115.pdf [accessed January 2019].

14. Sharma AM, Kushner RF. A proposed clinical staging system for obesity. Int J Obes 2009;33:289–95. https://doi.org/10.1038/ijo.2009.2

15. Aasheim E, Aylwin SJB, Radhakrishnan ST et al. Assessment of obesity beyond body mass index to determine benefit of treatment. Clin Obes 2011;1:77–84. https://doi.org/10.1111/j.1758-8111.2011.00017.x

Practical basics of coronary physiology

Br J Cardiol 2019;26:72–5doi:10.5837/bjc.2019.022 Leave a comment
Click any image to enlarge
Authors:

Coronary physiology is the collective term for a group of indexes aimed at directly measuring the intracoronary haemodynamic changes that occur across a stenosis in order to guide revascularisation decision-making. Fractional flow reserve (FFR) uses pharmacological dilatation and miniaturised pressure-wires to measure coronary pressure proximal and distal to a stenosis, thereby estimating flow reduction across a stenosis. Several clinical trials have shown that FFR-guided revascularisation improves clinical outcomes, and that deferring revascularisation in patients shown by FFR to have non-haemodynamically significant lesions is safe. Instantaneous wave-free ratio (iFR) is a novel technique that measures the ratio of distal coronary to aortic pressure during a specific period in diastole that obviates the need for pharmacological vasodilatation. Recent randomised-controlled trials have shown iFR to be non-inferior to FFR with respect to major adverse cardiac events, while reducing adverse procedural symptoms and procedure duration.

Introduction – why do we need coronary physiology?

It is increasingly appreciated that only coronary stenoses severe enough to cause myocardial ischaemia should undergo revascularisation. Reliable assessment of stenosis severity is, therefore, vital. For many years, invasive coronary angiography was considered to be the gold-standard test for the identification of flow-limiting coronary artery disease. This was largely due to the ‘oculo-stenotic reflex’ – a powerful stimulus that leads operators to believe that ischaemia must be present based on the severity of the coronary stenosis from visual assessment alone. However, identifying ischaemia using only a two-dimensional angiographic image grossly oversimplifies the relationship between a stenosed vessel (a complex three-dimensional structure) and the relevant area of subtended myocardium it supplies.

Since the pioneering work of Andreas Grüntzig in the late 1970s,1 efforts have been made to objectively quantify the haemodynamic impact of a stenosis, thereby circumventing many of the limitations of a visual-based approach to revascularisation decision-making. The approach of directly measuring intracoronary haemodynamic changes that occur across a stenosis is collectively termed ‘coronary physiology’. Following years of development (and the necessary miniaturisation of pressure-wire sensor technology), coronary physiology-guided revascularisation is now a well-established tool in the modern management of patients with stable coronary artery disease.

In this article, we review the scientific principles and key clinical outcome studies behind the two most commonly used coronary physiology indexes – the fractional flow reserve (FFR) and the instantaneous wave-free ratio (iFR). We also include instructional figures describing how to perform high-quality FFR/iFR measurements in routine clinical practice.

Fractional flow reserve

Basic principles

Myocardial ischaemia is a flow-based pathology. However, performing measurements of intracoronary flow is technically difficult and is, thus, largely confined to research settings. Attention has, therefore, turned to measuring intracoronary pressure (which is technically much simpler to measure), as a clinically applicable surrogate measure of flow. The basic principle of FFR is to eliminate the resistance of the microcirculation using pharmacological dilatation. This is termed maximal hyperaemia. Analogous to Ohm’s law (V=IR, where V is voltage difference, I is current and R is resistance), it can be assumed that when coronary resistance is stable and minimal (as occurs during maximal hyperaemia), a direct relationship exists between coronary pressure and flow. As such, in the context of hyperaemia, coronary pressure measurements can be used to assess the functional impact of a stenosis on the myocardium.

In 1993, Pijls et al.2 introduced FFR as a means of determining coronary flow using pressure-only-based assessments during hyperaemia. FFR is defined as the ratio of the pressure distal to a stenosis (Pd) relative to the pressure proximal to the stenosis (Pa) during maximal hyperaemia. As such, a FFR value of 0.80 represents a pressure loss across the stenosis of 20%.

FFR clinical outcome studies

Since its introduction, several studies have explored the clinical outcomes of patients whose revascularisation decision-making was guided by using FFR (table 1). The DEFER (Deferral Versus Performance of PTCA in Patients Without Documented Ischemia) study randomised 325 patients with stable coronary disease to one of three groups. Patients with a FFR ≥0.75 were randomly assigned to deferral or angioplasty, while those with a FFR <0.75 underwent angioplasty as planned.3 Originally reported outcomes at 24 months, in addition to longer-term follow-up at five and 15 years,4,5 showed that in patients with stable coronary disease, deferring revascularisation of a stenosis with a FFR ≥0.75 is comparatively safe and that revascularisation conferred no additional therapeutic benefit.

Sayers - Table 1. Summary characteristics and results in key fractional flow reserve (FFR) clinical outcome studies
Table 1. Summary characteristics and results in key fractional flow reserve (FFR) clinical outcome studies

The subsequent FAME study (Fractional Flow Reserve Versus Angiography for Multivessel Evaluation) assessed the clinical effectiveness of FFR-guided versus angiography-guided revascularisation of patients with multi-vessel coronary artery disease.6 One thousand and five patients with at least a 50% stenosis in two major epicardial arteries were randomised to undergo revascularisation using drug-eluting stents guided by angiography alone or FFR measurements. It should be noted that the FAME study used a higher FFR value of 0.80 as the clinical cut-off value for functionally significant lesions in an attempt to decrease the number of ischaemic lesions left untreated. The results of the FAME study showed that routine use of FFR-guided revascularisation in multi-vessel coronary artery disease was associated with a significant reduction in major cardiac adverse events (MACE) at one year compared with angiography alone.

The FAME 2 study7 built on these previous works by comparing FFR-guided percutaneous coronary intervention (PCI) plus optimal medical therapy (OMT). In this study, 1,220 patients with multi-vessel coronary artery disease had all stenoses visible on angiography measured using FFR. Patients with at least one stenosis with a FFR ≤0.8 underwent randomisation to either receive FFR-guided PCI plus OMT or OMT alone. Patients in whom all stenoses had a FFR >0.80 received OMT. The primary end point was a composite of death, myocardial infarction (MI) or urgent revascularisation. The study was halted prematurely due to a significant reduction in the composite primary end point in the PCI group. However, as this was driven by significantly fewer urgent revascularisations (in an unblinded study design), rather than decreased mortality or MI, the FAME 2 authors had to limit their conclusions to FFR-guided PCI plus OMT results in decreased rates or urgent revascularisation compared with OMT alone.

Instantaneous wave-free ratio

Basic principles

iFR was first invented in 2012 and has grown rapidly as a physiological index to guide revascularisation decision-making. Like FFR, iFR utilises intracoronary pressure to provide an estimation of intracoronary flow. However, unlike FFR, iFR achieves this task without requirement for pharmacological vasodilatation. This is because iFR measures the ratio of distal coronary to aortic pressure during a period in diastole where microvascular resistance is naturally at its most stable. By only measuring pressure within this specific portion of the cardiac cycle, iFR facilitates the pressure-only assessment of the haemodynamic impact of a coronary stenosis without the need for pharmacological vasodilatation.

iFR clinical outcome studies

Recent clinical outcome studies have addressed the safety of using an iFR-alone versus FFR-alone approach to guide revascularisation decision-making (table 2). The DEFINE-FLAIR (Functional Lesion Assessment of Intermediate Stenosis to Guide Revascularisation)8 and the iFR-SWEDEHEART (Instantaneous Wave-Free Ratio Versus Fractional Flow Reserve in Patients With Stable Angina Pectoris or Acute Coronary Syndrome Trial)9 trials randomised patients with coronary stenosis of intermediate severity to undergo either FFR-guided or iFR-guided revascularisation, using cut-off values for FFR and iFR of 0.8 and 0.89, respectively. Both trials included stable angina patients and also those with acute coronary syndrome (ACS) with non-culprit intermediate disease and are the largest coronary physiology trials ever conducted.

Sayers - Table 2. Summary characteristics and results in key instantaneous wave-free ratio (iFR) clinical outcome studies
Table 2. Summary characteristics and results in key instantaneous wave-free ratio (iFR) clinical outcome studies

The primary results of DEFINE-FLAIR and iFR-SWEDEHEART demonstrated that iFR-guided revascularisation was non-inferior to FFR with respect to MACE at one year. In addition, several secondary outcomes favoured iFR. Both trials showed over a 10-fold reduction in adverse procedural symptoms in the iFR group compared with the FFR group, as well as shorter duration of procedure. Furthermore, a meta-analysis of the DEFINE-FLAIR and iFR-SWEDEHEART studies also revealed that significantly less myocardial revascularisation (by either PCI or coronary artery bypass graft [CABG]) was performed when iFR was used.10

Following these landmark trials, the most recent European Society of Cardiology (ESC) guidelines have granted iFR a class 1A recommendation in assessing the haemodynamic relevance of intermediate-grade stenoses.11

iFR pullback – the future of coronary physiological assessment?

An important advantage of iFR over FFR is in the evaluation of coronary arteries in which there are serial stenoses, i.e. two or more lesions within the same coronary vessel. In serial stenoses, physiological assessment with FFR is confounded by the cross-communication that exists between stenoses under hyperaemia. In this situation, hyperaemic flow through one stenosis is limited by the presence of another stenosis and vice versa. However, because resting coronary flow remains stable across almost the entire range of stenosis severities, resting assessment of pressure changes using iFR allows isolated assessment of an individual stenosis, even when in series.12 By measuring continuously during a manual pressure-wire pullback, iFR pullback is able to map and quantify the haemodynamic significance of each individual stenosis, as well as allowing operators to predict the physiological benefits of revascularisation – so called ‘virtual PCI’ (figure 1).13

Sayers - Figure 1. Instantaneous wave-free ratio (iFR) pullback in serial lesions. A: angiography shows serial proximal (orange arrow) and distal (yellow arrow) lesions in the obtuse marginal branch. B: actual panel of iFR pressure-wire pullback. Proximal (orange arrow) and distal (yellow arrow) pressure gradients separately demonstrated. iFR pullback can identify severity of each stenosis in serial lesions
Figure 1. Instantaneous wave-free ratio (iFR) pullback in serial lesions. A: angiography shows serial proximal (orange arrow) and distal (yellow arrow) lesions in the obtuse marginal branch. B: actual panel of iFR pressure-wire pullback. Proximal (orange arrow) and distal (yellow arrow) pressure gradients separately demonstrated. iFR pullback can identify severity of each stenosis in serial lesions

How to perform a pressure-wire assessment?

Regardless of the choice of physiological index used to guide revascularisation decision-making, reproducible high-quality measurements are essential to ensure that accurate FFR or iFR measurements are obtained (figure 2). After diagnostic angiography, a sensor guidewire is passed through an angioplasty Y-connector attached to a diagnostic or guiding catheter. Heparin and nitroglycerin are then given to minimise vasomotion, ensuring high-quality and accurate measurements. After calibration against atmospheric pressure, the sensor-wire is then introduced into the patient and positioned at the tip of the guiding catheter, thereby enabling the pressure in the aorta and that recorded by the pressure-wire transducer to be equalised (figure 3). The wire is then advanced across the stenosis and, when performing FFR, a pharmacological hyperaemic stimulus (usually adenosine) is then administered. At peak hyperaemia, the FFR is calculated as the ratio between the mean distal coronary pressure (measured by the pressure wire) and mean aortic pressure (measured by the guiding catheter).14

Sayers - Figure 2. Steps in performing a pressure-wire assessment
Figure 2. Steps in performing a pressure-wire assessment
Sayers - Figure 3. Performing a fractional flow reserve (FFR) measurement. A: equalisation of pressure-wire when the pressure sensor is at the tip of the guiding catheter. A white arrow indicates the radiopaque junction of the pressure wire where pressure sensor is equipped. B: actual panel of equalisation. Pd/Pa shows 1.0. Red and yellow waves indicate Pa and Pd, respectively. They fit completely (equalised). Red and yellow curves indicate mean of Pa and Pd, respectively. White wave indicates electrocardiogram (ECG). C: actual panel of measuring FFR. FFR shows 0.74. Remarkable decrease of pressure gradient was demonstrated after administration of adenosine
Figure 3. Performing a fractional flow reserve (FFR) measurement. A: equalisation of pressure-wire when the pressure sensor is at the tip of the guiding catheter. A white arrow indicates the radiopaque junction of the pressure wire where pressure sensor is equipped. B: actual panel of equalisation. Pd/Pa shows 1.0. Red and yellow waves indicate Pa and Pd, respectively. They fit completely (equalised). Red and yellow curves indicate mean of Pa and Pd, respectively. White wave indicates electrocardiogram (ECG). C: actual panel of measuring FFR. FFR shows 0.74. Remarkable decrease of pressure gradient was demonstrated after administration of adenosine

Conclusion

Coronary physiology-guided revascularisation with either FFR or iFR represents contemporary gold-standard practice for the invasive management of patients with intermediate severity coronary artery disease. Recent clinical trials support the use of iFR alone, particularly in guiding revascularisation of tandem lesions.

While current treatment guidelines interpret the results of coronary physiology in a binary fashion (i.e. FFR ≤0.80 ‘ischaemic’ versus FFR >0.80 ‘non-ischaemic’), it should always be remembered that ischaemia is in fact a continuum of disease. As such, revascularisation decisions, particularly when coronary physiology measurements are borderline, should always be interpreted on an individual patient basis utilising all of the available clinical information.

Key messages

  • Visual assessment by traditional coronary angiography is unable to distinguish whether a coronary stenosis is haemodynamically significant, particularly in intermediate severity coronary artery disease
  • Coronary physiology-guided revascularisation with either fractional flow reserve (FFR) or instantaneous wave-free ratio (iFR) is able to directly measure intracoronary haemodynamic changes in order to guide revascularisation decision-making
  • FFR uses pharmacological vasodilatation to eliminate microvascular resistance and is defined as the ratio of the pressure distal to a stenosis (Pd) relative to the pressure proximal to the stenosis (Pa) during hyperaemia
  • iFR measures the ratio of distal coronary to aortic pressure during a specific period in diastole where microvascular resistance is at its most stable, thereby eliminating the need for pharmacological vasodilatation
  • Regardless of the choice of physiological index used to guide revascularisation decision-making, high-quality, reproducible measurements are essential to ensure accurate FFR or iFR measurements are obtained

Conflicts of interest

MS none declared; CC and TW have received consulting fees from Philips; JD holds patents pertaining to the iFR technology. JD is a consultant for Philips Volcano and has received research grants from Philips Volcano.

References

1. Grüntzig AR, Senning A, Siegenthaler WE. Nonoperative dilatation of coronary-artery stenosis: percutaneous transluminal coronary angioplasty. N Engl J Med 1979;301:61–8. https://doi.org/10.1056/NEJM197907123010201

2. Pijls NHJ, van Son JAM, Kirkeeide RL, De Bruyne B, Gould KL. Experimental basis of determining maximum coronary, myocardial, and collateral blood flow by pressure measurements for assessing functional stenosis severity before and after percutaneous transluminal coronary angioplasty. Circulation 1993;87:1354–67. https://doi.org/10.1161/01.CIR.87.4.1354

3. Bech GJW, De Bruyne B, Pijls NHJ et al. Fractional flow reserve to determine the appropriateness of angioplasty in moderate coronary stenosis: a randomized trial. Circulation 2001;103:2928–34. https://doi.org/10.1161/01.CIR.103.24.2928

4. Pijls NHJ, van Schaardenburgh P, Manoharan G et al. Percutaneous coronary intervention of functionally nonsignificant stenosis: 5-year follow-up of the DEFER study. J Am Coll Cardiol 2007;49:2105–11. https://doi.org/10.1016/j.jacc.2007.01.087

5. Zimmermann FM, Ferrara A, Johnson NP et al. Deferral vs. performance of percutaneous coronary intervention of functionally non-significant coronary stenosis: 15-year follow-up of the DEFER trial. Eur Heart J 2015;36:3182–8. https://doi.org/10.1093/eurheartj/ehv452

6. Tonino PAL, De Bruyne B, Pijls NHJ et al.; FAME Study Investigators. Fractional flow reserve versus angiography for guiding percutaneous coronary intervention. N Engl J Med 2009;360:213–24. https://doi.org/10.1056/NEJMoa0807611

7. De Bruyne B, Pijls NHJ, Kalesan B et al.; FAME 2 Trial Investigators. Fractional flow reserve–guided PCI versus medical therapy in stable coronary disease. N Engl J Med 2012;367:991–1001. https://doi.org/10.1056/NEJMoa1205361

8. Davies JE, Sen S, Dehbi HM et al. Use of the instantaneous wave-free ratio or fractional flow reserve in PCI. N Engl J Med 2017;376:1824–34. https://doi.org/10.1056/NEJMoa1700445

9. Götberg M, Christiansen EH, Gudmundsdottir IJ et al.; iFR SWEDEHEART Investigators. Instantaneous wave-free ratio versus fractional flow reserve to guide PCI. N Engl J Med 2017;376:1813–23. https://doi.org/10.1056/NEJMoa1616540

10. Escaned J. Safety of coronary revascularisation deferral based on iFR and FFR measurements in stable angina and acute coronary syndromes. Presented at EuroPCR 2017 on 1 May 2017 in Paris, France. Available from: https://solaci.org/_files/PCR2017/EscanedJavier.pdf

11. Neumann FJ, Sousa-Uva M, Ahlsson A et al. 2018 ESC/EACTS guidelines on myocardial revascularization. Eur Heart J 2018;40:87–165. https://doi.org/10.1093/eurheartj/ehy394

12. Nijjer SS, Sen S, Petraco R et al. Preangioplasty instantaneous wave-free ratio pullback provides virtual intervention and predicts hemodynamic outcome for serial lesions and diffuse coronary artery disease. JACC Cardiovasc Interv 2014;7:1386–96. https://doi.org/10.1016/j.jcin.2014.06.015

13. Kikuta Y, Cook CM, Sharp ASP et al. Pre-angioplasty instantaneous wave-free ratio pullback predicts hemodynamic outcome in humans with coronary artery disease: primary results of the international multicenter iFR GRADIENT registry. JACC Cardiovasc Interv 2018;11:757–67. https://doi.org/10.1016/j.jcin.2018.03.005

14. Kern MJ, Lerman A, Bech JW et al. Physiological assessment of coronary artery disease in the cardiac catheterization laboratory: a scientific statement from the American Heart Association Committee on Diagnostic and Interventional Cardiac Catheterization, Council on Clinical Cardiology. Circulation 2006;114:1321–41. https://doi.org/10.1161/CIRCULATIONAHA.106.177276

Quick takes from ACC.19: The American College of Cardiology 68th Annual Scientific Sessions

Br J Cardiol 2019;26:50 Leave a comment
Click any image to enlarge
Authors:

The American College of Cardiology (ACC.19) Annual Scientific Sessions represents one of the most exalted venues for investigators to present the latest studies that could potentially impact cardiology practice. Held in New Orleans, US, from 16th – 18th March 2019, Drs Gerald Chi, Syed Hassan Abbas Kazmi and C Michael Gibson give their ‘quick takes’ from the meeting and summarise the main results from six landmark studies presented there: PARTNER 3, Evolut Low Risk, MOMENTUM 3, AUGUSTUS, COACT, and the Apple Heart Study.

American College of Cardiology, 2019, New Orleans, US
ACC.19 was held in New Orleans, US

PARTNER 3 and Evolut Low Risk add to evidence base for TAVR

Prior literature suggests that transcatheter aortic-valve replacement (TAVR) is non-inferior or even superior to standard surgical aortic-valve replacement (SAVR) among high and intermediate surgical risk patients with aortic stenosis (AS). Two pivotal studies have now addressed the efficacy and safety of TAVR in AS patients at low mortality risk from surgery.

PARTNER 3 (ClinicalTrials.gov: NCT02675114) was an open-label trial that randomised 1,000 subjects with severe AS at low mortality risk from surgery into either TAVR with a third-generation balloon-expandable valve (SAPIEN™ 3 system) or SAVR.1 The one-year risk of death, stroke, or rehospitalisation was lower in the TAVR group than the SAVR group (8.5% vs. 15.1%; hazard ratio [HR] =0.54 [95% confidence interval (CI): 0.37–0.79]; p=0.001 for superiority). TAVR was also associated with a lower 30-day risk of stroke (0.6% vs. 2.4%), death or stroke (1.0% vs. 3.3%), new-onset atrial fibrillation (AF) (5.0% vs. 39.5%), life-threatening or major bleeding (3.6% vs. 24.5%), and a shorter hospital stay (3 days vs. 7 days) compared to SAVR.

Evolut Low Risk (ClinicalTrials.gov: NCT02701283) was an open-label trial that randomised 1,468 low-risk severe AS patients into either TAVR with one of three self-expanding supraannular bioprosthesis valves (CoreValve™, Evolut R™, or Evolut PRO™) or SAVR.2 The two-year risk of death or disabling stroke was lower in the TAVR group than the SAVR group (5.3% vs. 6.7%; posterior probability of non-inferiority >0.999). TAVR was also associated with a lower 30-day risk of death or disabling stroke (0.8% vs. 2.6%), disabling stroke (0.5% vs. 1.7%), AF (7.7% vs. 35.4%), stage 2 or 3 acute kidney injury (0.9% vs. 2.8%), and life-threatening or disabling bleeding (2.4% vs. 7.5%) compared to SAVR.

While the long-term outcome and risk of subclinical leaflet thrombosis or structural valve degeneration remain uncertain, these studies expand the treatment avenue for a sizable number of patients with severe AS.

MOMENTUM 3 shows promise for new HeartMate 3™ device

Another noteworthy potential advance in the mechanical circulatory support for advanced heart failure (HF) is the HeartMate 3™ device, a fully magnetically levitated pulsatile centrifugal-flow system without mechanical bearings. Revamped from its previous generation (HeartMate II™, a continuous axial-flow system with mechanical bearings), HeartMate 3™was developed to further improve hemocompatibility-related adverse events including pump thrombosis, stroke, and bleeding.

MOMENTUM 3 (ClinicalTrials.gov: NCT03335800) was an open-label trial in 1,028 patients with advanced HF randomised to either a centrifugal-flow pump (HeartMate 3™) or an axial-flow pump (HeartMate II™), regardless of the intended goal of bridging to transplantation or destination therapy.3 Compared with the HeartMate II™ device, the early benefits of the HeartMate 3 device persisted for two years, with a favourable survival free from disabling stroke or reoperation to replace or remove a malfunctioning device (76.9% vs. 64.8%; relative risk [RR]=0.84 [95% CI: 0.78–0.91]; p<0.001 for superiority). Pump replacement (2.3% vs. 11.3%), pump thrombosis (1.4% vs. 13.9%), stroke (9.9% vs. 19.4%), disabling stroke (5.0% vs. 7.5%), bleeding (43.7% vs. 55.0%), and gastrointestinal bleeding (24.5% vs. 30.9%) were less frequent in the HeartMate 3™ group than in the HeartMate II™ group.

Data from the MOMENTUM 3 trial speak to the potential of a durable left ventricular assist device as a viable alternative to transplantation among patients with end-stage HF.

AUGUSTUS: apixaban in the treatment of ACS and AF

Lowering the ischaemic risk while controlling the bleeding risk with antithrombotic agents for acute coronary syndrome (ACS) AF has been a clinical conundrum.

AUGUSTUS (ClinicalTrials.gov: NCT02415400) was an open-label, randomised, two-by-two factorial trial comparing the safety of the direct oral anticoagulant (DOAC) apixaban versus a vitamin K antagonist (VKA) and aspirin versus placebo in 4,614 patients with AF and recent ACS or percutaneous coronary intervention (PCI) on background therapy with a P2Y12 inhibitor for six months.4 Compared with those receiving VKA, patients receiving apixaban had a lower rate of major or clinically relevant nonmajor bleeding (10.5% vs. 14.7%; HR=0.69 [95% CI: 0.58–0.81]) and death or hospitalisation (23.5% vs. 27.4%; HR=0.83; [95% CI: 0.74–0.93]) at six months. The aspirin group sustained more bleeding than the placebo group (16.1% vs. 9.0%; HR=1.89 [95% CI: 1.59–2.24]), but the incidence of ischaemic events was similar.

Consistent with the PIONEER AF-PCI and RE-DUAL PCI trials, the AUGUSTUS trial offers compelling evidence favouring a direct oral anticoagulant over VKA as the anticoagulant therapy for the AF-ACS population.

COACT sheds light on timing for coronary angiography

Although coronary artery disease is common in patients with cardiac arrest, the appropriate timing of coronary angiography is unclear when there is no evidence of ST-segment elevation on electrocardiography (ECG).

COACT (Netherlands Trial Register number: NTR4973) was an open-label, randomised trial comparing the strategy of immediate angiography versus delayed angiography among 552 successfully resuscitated patients following out-of-hospital cardiac arrest without ST-segment elevation on the ECG after the return of spontaneous circulation.5 At 90 days, 64.5% in the immediate angiography group and 67.2% in the delayed angiography group were alive (odds ratio [OR]=0.89 [95% CI: 0.62–1.27]; p=0.51). There was no significant difference in secondary end points, except that the immediate angiography group attained the target temperature later than the delayed angiography group (5.4 hours vs. 4.7 hours; ratio of geometric means=1.19 [95% CI: 1.04–1.36]).

Provided the low rate of thrombotic occlusion (5.0%) and lack of survival benefit, the COACT trial indicates that immediate angiography with intent to revascularise may not be necessary for patients without ST-elevation after a cardiac arrest.

Apple Heart Study

In the realm of digital health, there is an emerging interest in detecting arrhythmia by the wearable device, such as a smartwatch. The Apple Heart Study (ClinicalTrials.gov: NCT03335800) was an open-label study that assessed the ability of an irregular pulse notification-algorithm by The Apple Watch to identify AF and guide subsequent clinical evaluation in 419,297 self-enrolled participants.6

A notification was received by 2,161 (0.5%) participants, more frequently (3.1%) in those aged ≥65 years. A total of 450 participants had an ECG patch analysis after a telehealth consultation by the study physician and 34% had confirmed AF, yielding a positive predictive value of 84%. Among 1,376 subjects who completed the end-of-study survey at 90 days, 57% sought medical care outside the study for starting a new medication, referral to a specialist, or additional testing.

Building upon these results, the upcoming HEARTLINE trial will examine whether the use of ECG app on Apple Watch can improve AF diagnosis, clinical outcome, and medication adherence.

Each of these late-breaking studies represents a potential advance in their respective field of cardiovascular medicine. Whether these trials will be integrated into practice guidelines will be determined in the near future.

Conflicts of interest

GC and SHAK receive research grant support paid to the Beth Israel Deaconess Medical Center, Harvard Medical School from Portola Pharmaceuticals, Bayer, and Janssen Scientific Affairs. CMG receives consultant fees from Portola Pharmaceuticals and reports grants from Angel Medical Corporation and CSL Behring; grants and other support from Bayer Corporation; grants and personal fees from Janssen, Johnson & Johnson, and Portola Pharmaceuticals; and personal fees from The Medicines Company, Boston Clinical Research Institute, Cardiovascular Research Foundation, Eli Lilly, Gilead Sciences Inc, Novo Nordisk, Pfizer, Web MD, UpToDate in Cardiovascular Medicine, Amarin Pharma, Amgen, Arena Pharmaceuticals, Bayer Corporation, Boehringer Ingelheim, Chiesi, Merck & Co, PharmaMar, Sanofi, Somahlution, St Francis Hospital, and Verreseon Corporation.

Gerald Chi
Syed Hassan Abbas Kazmi
C Michael Gibson

Division of Cardiovascular Medicine, Department of Medicine, Beth Israel Deaconess Medical Center, Harvard Medical School, 930 Commonwealth Avenue, Ste 3, Boston, Massachusetts 02215, United States

Correspondence to: Dr CM Gibson ([email protected])

References

1. Mack MJ, Leon MB, Thourani VH, Makkar R, Kodali SK, Russo M, et al. Transcatheter Aortic-Valve Replacement with a Balloon-Expandable Valve in Low-Risk Patients. N Engl J Med. 2019;380(18):1695-705.

2. Popma JJ, Deeb GM, Yakubov SJ, Mumtaz M, Gada H, O’Hair D, et al. Transcatheter Aortic-Valve Replacement with a Self-Expanding Valve in Low-Risk Patients. N Engl J Med. 2019;380(18):1706-15.

3. Mehra MR, Uriel N, Naka Y, Cleveland JC, Jr., Yuzefpolskaya M, Salerno CT, et al. A Fully Magnetically Levitated Left Ventricular Assist Device – Final Report. N Engl J Med. 2019;380(17):1618-27.

4. Lopes RD, Heizer G, Aronson R, Vora AN, Massaro T, Mehran R, et al. Antithrombotic Therapy after Acute Coronary Syndrome or PCI in Atrial Fibrillation. N Engl J Med. 2019;380(16):1509-24.

5. Lemkes JS, Janssens GN, van der Hoeven NW, Jewbali LSD, Dubois EA, Meuwissen M, et al. Coronary Angiography after Cardiac Arrest without ST-Segment Elevation. N Engl J Med. 2019;380(15):1397-407.

6. Turakhia M, Perez M. Results of a Large-scale, App-based Study to Identify Atrial Fibrillation Using a Smartwatch: The Apple Heart Study 2019 [Available from: https://www.acc.org/~/media/Clinical/PDF-Files/Approved-PDFs/2019/03/15/ACC19_Slides/Mar16_Sat/10amET_Apple-Heart-Study-acc-2019.pdf]

New infective endocarditis information card available

Br J Cardiol 2019;26:49 Leave a comment
Click any image to enlarge
Authors:

A new infective endocarditis information card is available to help healthcare professionals meet the latest guidance for this condition.

It has been produced following the recent change to National Institute of Health and Care Excellence (NICE) guidance, which recognises that antibiotic prophylaxis may sometimes be indicated in high-risk patients having invasive dental procedures.1 In addition, as a result of the Montgomery case,2 new Scottish guidance3 on implementing the NICE document stresses the need for the patient to discuss with their cardiologist or surgeon whether or not antibiotic prophylaxis is indicated and to record the decision.

The card allows this discussion to be recorded. It also gives guidance on what cardiac conditions are regarded as moderate or high-risk for endocarditis, what dental procedures are high-risk and what antibiotics should be prescribed. This card has been endorsed by both the British Heart Valve Society and the British Cardiovascular Society.

Improving outcomes also involves recognising endocarditis early. Since most GPs will never see a case and since the early signs of endocarditis may be indistinguishable from self-limiting viral illnesses, it is appropriate for an informed patient to make the suggestion. Furthermore, one half of cases of culture negative endocarditis occur as a result of antibiotic treatment. This card therefore includes a prompt on when to suspect endocarditis and suggests that a GP considers taking blood cultures before starting antibiotics if endocarditis is possible.

References

1. National Institute for Health and Care Excellence. Prophylaxis against infective endocarditis: antimicrobial prophylaxis against infective endoacrditis in adults and children undergoing interventional procedures. Clinical guideline 64. London: NICE, July 2016. https://www.nice.org.uk/guidance/cg64 (accessed 13 March 2019)

2. Southerland L. Montgomery in the Supreme Court: a new legal test for consent to medical treatment. 2015. http://www.scottishlegal.com/2015/03/12/montgomery-in-the-supreme-court-a-new-legal-test-for-consent-to-medical-treatment/ (accessed 13 March 2019)

3. Scottish Dental Clinical Effectiveness Programme: antibiotic prophylaxis against infective endocarditis August 2018. http://www.sdcep.org.uk/published-guidance/antibiotic-prophylaxis (accessed 13 March 2019)

In briefs

Br J Cardiol 2019;26:52 Leave a comment
Click any image to enlarge
Authors:

This new high-sensitivity troponin 1 assay (Vitros®, Ortho, pictured below) can deliver first troponin results in 15 minutes and can also identify low-risk patients who may be safely discharged. It is hoped it will help reduce the cost of care and alleviate the burden on hospital resources.

Stat tests loaded into the VITROS XT 7600

Moderate alcohol consumption does not protect against stroke

Blood pressure and stroke risk increase steadily with increasing alcohol intake, and previous claims that one to two alcoholic drinks a day might protect against stroke are not borne out by new evidence from a genetic study involving 160,000 adults.

Studies of East Asian genes, where two common genetic variants strongly affect what people choose to drink, show that alcohol itself directly increases blood pressure and the chances of having a stroke, according to a new study published in The Lancet (doi: 10.1016/S0140-6736(18)31772-0).

Researchers from Oxford University, Peking University, and the Chinese Academy of Medical Sciences led a large collaborative study of over 500,000 men and women in China who were asked about their alcohol intake and followed for 10 years. In over 160,000 of these adults the researchers measured two genetic variants (rs671 and rs1229984) that substantially reduce alcohol intake.

Among men, these genetic variants caused a 50-fold difference in average alcohol intake, from near zero to about four units (drinks) per day. The genetic variants that decreased alcohol intake also decreased blood pressure and stroke risk.

From this evidence, the authors conclude that alcohol increases the risk of having a stroke by about one-third (35%) for every four additional drinks per day (280 g of alcohol a week), with no protective effects of light or moderate drinking.

CREDENCE: renal failure reduced in diabetes and CKD patients

Kidney disease develops in approximately 40% of people with type 2 diabetes. A new study has shown that the SGLT2 inhibitor, canaglifozin (Invokana®, Napp) reduces the risk of renal and cardiovascular (CV) events when added to the standard of care in subjects with type 2 diabetes.

The primary end point (the risk of composite of doubling of serum creatinine, end-stage kidney disease (ESKD) and renal or CV death) was reduced by 30% with canagliflozin compared to placebo in the CREDENCE (Canagliflozin and Renal Endpoints in Diabetes with Established Nephropathy Clinical Evaluation) study.

Several secondary end points were also achieved including a reduction in the risk of the secondary renal end point composite of doubling of serum creatinine, ESKD, and renal death by 34%; a reduction in the the risk of major adverse cardiac events (MACE) (composite of non-fatal myocardial infarction, non-fatal stroke and CV death) by 20%; the risk of CV death and hospitalisation for heart failure by 31%; and the risk of hospitalisation for heart failure alone by 39%.

Canaglifozin also showed an acceptable safety profile consistent with previous studies. The incidence rates of adverse events and serious adverse events were numerically lower for patients treated with canagliflozin compared to placebo, and there was no difference in the number of lower limb amputations or adjudicated fractures.

The study was published in the New England Journal of Medicine (doi: 10.1056/NEJMoa1811744).

Call for more cardio-oncology specialists

The number of cardiologists trained in cardio-oncology, the treatment of cardiovascular disease in patients treated for cancer, does not currently meet the needs of this rapidly growing population, according to a review paper in the Journal of the American College of Cardiology (doi: 10.1016/j.jacc.2019.02.041)

Advances in early detection and treatment of cancer have led to a rise in the number of cancer survivors. It is estimated that by 2026 there will be 20 million cancer survivors in the US and half will be 70 years old or older. The combination of an ageing population of cancer survivors with co-morbid cardiovascular disease and growing list of cancer treatments that effect the cardiovascular system have led to the need for cardiovascular specialists with an in-depth understanding of the intersection of these diseases.

“Inclusion of cardio-oncology as a component of general cardiology training programs is the first step at establishing a workforce capable of recognising and managing the complex cardiovascular burdens associated with cancer in every community,” said study author Dr Bonnie Ky (Associate Professor of Medicine and Epidemiology at the Perelman School of Medicine at the University of Pennsylvania, US). 

In the UK, cancer survival has doubled over the last 40 years.

Statins found to be safe in rheumatoid arthritis

Patients with rheumatoid arthritis have an approximately 50% higher risk of experiencing cardiovascular events compared with the general population but it has been unclear whether statins are safe for people with inflammatory conditions, such as rheumatoid arthritis.

Results from a large clinical trial indicate that patients with rheumatoid arthritis are likely to experience the same level of cardiovascular benefits from statins as other individuals, without additional risks.

TRACE RA (Trial of Atorvastatin for the Primary Prevention of Cardiovascular Events in Patients with Rheumatoid Arthritis) compared the statin atorvastatin 40 mg with placebo in 3,002 patients with rheumatoid arthritis who were over aged 50 years or had rheumatoid arthritis for more than 10 years, without clinical atherosclerosis, diabetes, or myopathy.

During a median follow-up of 2.5 years, 1.6% of patients who received atorvastatin and 2.4% of patients receiving placebo experienced cardiovascular death, heart attack, stroke, transient ischaemic attack, or any arterial revascularisation, a 40% lower risk of cardiovascular events for patients taking atorvastatin, although the difference was not statistically significant since the overall rate of events was low.

Patients taking atorvastatin, however, had significantly lower low-density lipoprotein (LDL) cholesterol as well as significantly lower levels of the inflammatory marker C-reactive protein, with patients taking placebo. Adverse events in the atorvastatin and placebo groups were similar.

The study was published in Arthritis & Rheumatology (doi: 10.1002/art.40892).

AF now the leading cause of cardiovascular hospitalisation

Research in Australia has shown that hospitalisations for atrial fibrillation (AF) have now overtaken those for myocardial infarction (MI) and heart failure.

Researchers at the University of Adelaide Centre for Heart Rhythm Disorders analysed data from the Australian Institute of Health and Welfare between 1993–2013. In 1993, heart failure was the most common cause of hospitalisation followed by MI and AF. In 2013, hospitalisations for AF had increased to 61,000 from 15,000 in 1993 (295% increase) compared to MI (73% increase) and heart failure (39% increase).

The study is published The Lead (http://theleadsouthaustralia.com.au/?p=8338).