Ejection fraction (EF) offers a remarkable approach to assess ventricular and atrial pumping capacity. Its value can easily be calculated, and it seems to reflect performance. However, EF is a non-preferred candidate from a conceptual point of view. To fully understand the weakness of the EF metric, it is necessary to appreciate that its numerical value (by its definition) solely depends on end-systolic volume (ESV) and end-diastolic volume (EDV). This tight mathematical connection can best be graphically represented in the ventricular volume domain while relating ESV to EDV, leading to straight conclusions about EF.
No previous paper has addressed the curious tradition of applying EF in cardiology in terms of the indirect reasons for its popularity, as well as the intrinsic shortcomings, alongside the statistical irregularities involved. This review highlights the misleading attractiveness of EF, while also offering logical alternatives without invoking the need for relying on additional data beyond standard measurements.
Obscure origin of the ejection fraction metric
Only rarely have investigators revealed the origins of the popular metric called ejection fraction (EF), while, for example, referring to William Harvey or to a psychiatrist.1 Recently, a position paper reported that in 1918 MacKenzie ‘measured’ EF using heart rate and pulse pressure.2 However, one thing is clear: a rigorously documented foundation is absent.3 Fact is that more than a century ago Bardeen directly calculated the ratio of left ventricular (LV) stroke volume (SV) and end-diastolic volume (EDV).4
Indeed, there is no single published paper that explains, in full detail, what the exact reasons are for employing the mathematical EF construct as a crucial metric whenever evaluating a patient with cardiac problems.3 It looks like its use stems from convenient tradition, even though the solid scientific rationale is lacking. Yet, in daily practice, EF seems to work favourably well when indicating severity of ventricular disease, or if used for phenotyping. Also, it appears to reflect improvement with favourable therapy, or deterioration with disease progression.5
Undoubtedly, there are serious pitfalls when interpreting ratio-based metrics, such as EF.3,6 This contribution addresses the emergence of EF as an indicator of ‘function’, with almost unlimited popularity during more than a half century, and the barely admitted flaws. Also, the consequences of proper interpretation will be discussed, as well as powerful alternatives for EF.
After all, the simple explanation for absence of a robust foundation may very well be the notion that EF is just a troublesome metric by design. This insightful aspect will be outlined in the present review.
The scope of investigations around EF
The topic explored here is rather simple, as we are dealing with just two variables, namely end-systolic volume (ESV) and EDV. The EF (as a percentage) is defined as 100 × (EDV – ESV)/EDV, where (EDV – ESV) equals SV. This can be rewritten as: EF = 100 × SV/(ESV + SV), where EF exclusively depends on SV and ESV. To evaluate how EF depends on ESV, we can employ the model by taking SV at various constant levels. The theoretical relationship between EF and ESV for two fixed values of SV is shown in figure 1, based on our simple simulation model. The two curves exhibit a similar pattern, where the one with the larger SV runs above the other one. This observation explains why any constant level of EF is associated with numerous values for ESV. This fact implies that EF is not a unique metric,6 and, thus, cannot characterise cardiac performance.
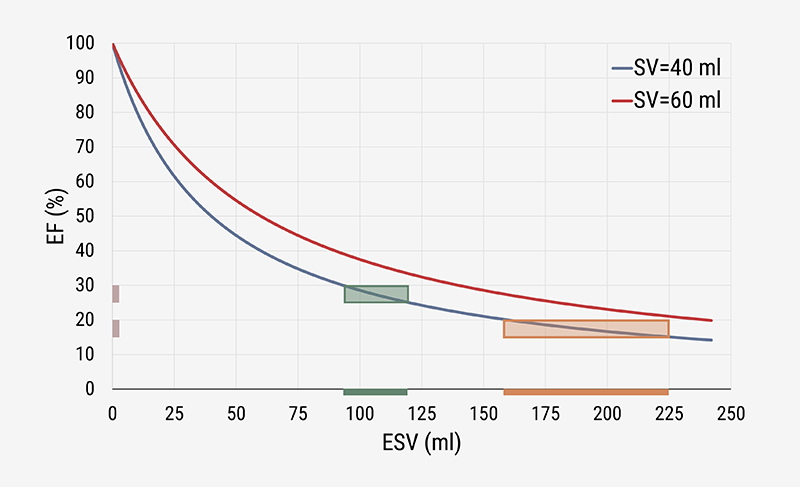
Regardless of the particular value selected for SV, we find that EF always decreases with increasing values of ESV, albeit in a nonlinear manner. The graph strongly suggests that EF and ESV are intimately associated. This important finding is confirmed in numerous clinical studies.3,6,7 The curves also show that, within the higher volume region (to the right side), a larger variation of ESV is required to induce a similar change in EF. The larger variation at lower EF values indicates that, in that particular region, the ESV may be a more relevant variable to study. Clinical practice confirms that this is indeed the case. In the evaluation of ventricular remodelling, the ESV is employed as the preferable candidate to focus on,8 rather than on the calculated EF.9
Alternatively, one may think about the association between EF and the other variable involved, namely EDV. Both theory10 and practical experience3,6,7 indicate that their association is rather diffuse, and it is not worth discussing EF versus EDV within the present context.
Two observations are important for clinicians when considering EF:
- The EF (%) refers to a dimensionless ratio, defined as 100 × (1 – ESV/EDV). Thus, the actual number calculated for EF depends on the balance between ESV and EDV. Notably, same-direction changes (either increases or decreases) keep the calculated value the same if their relative variations are equal (when each goes up, e.g. by 5%, or both decrease by the same %).3
- The fact that EF is calculated, not measured, has serious implications for statistical evaluations. Notably, in an agreement evaluation of two (imaging) methods, the Bland-Altman analysis may not apply.11 Furthermore, when making a comparison of intervention versus baseline data, the EF comparison may not be appropriate.3,9
Three canonical graphs
Three fundamental graphical representations can be identified.
The volume-regulation graph
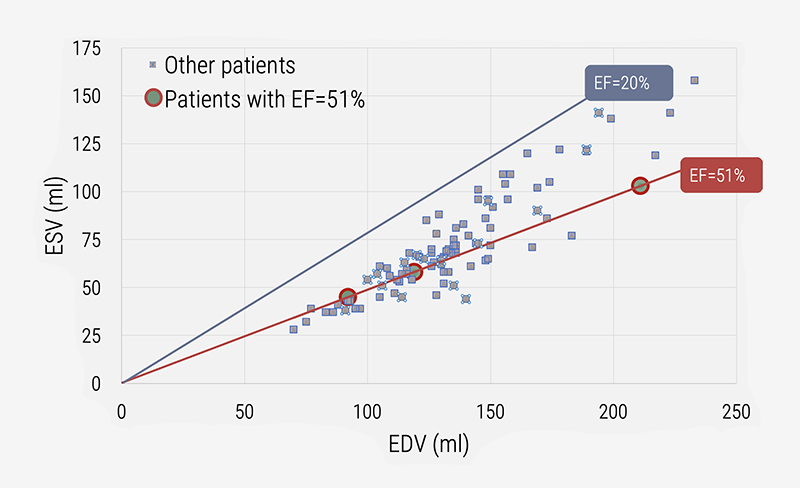
ESV and EDV are primary variables to characterise ventricular and atrial pumping performance. Therefore, it is logical to combine these two in a graphical representation that also allows characterisation of derived (calculated) metrics. Figure 2 shows the association between ESV and EDV for 96 cardiac patients evaluated by cardiac magnetic resonance (CMR).7,12 All patients having the same value for EF are positioned on the pertaining iso-EF line, as indicated for three patients with EF=51%. For them the ESV, EDV and SV are all different, as well as their associated LV pressure-volume loops.12
The EF versus ESV curvilinear relationship
The family of EF versus ESV curves can theoretically be derived (as shown in figure 1, based on various values for SV), and likewise presented for actual patient data, as in figure 3A. Now, the iso-EF line of 51% is horizontal, and the three patients (with different diagnostic characteristics) are identified as indicated by the coloured arrows.
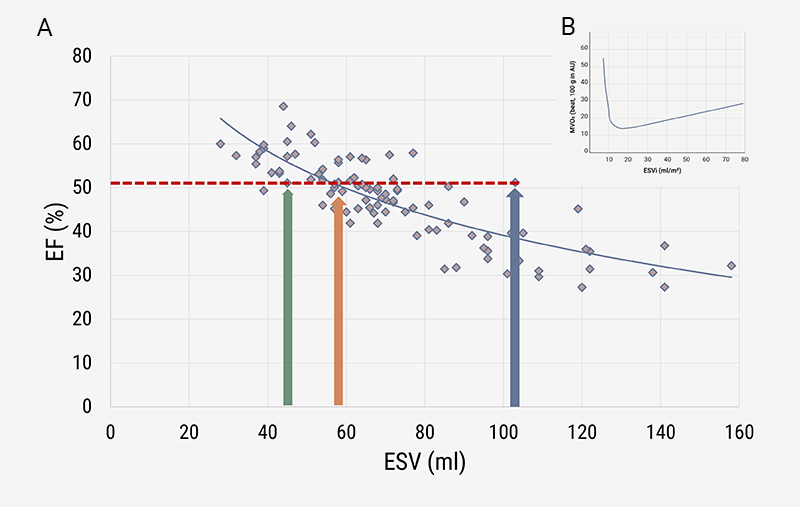
| Key: AU = arbitrary unit |
Oxygen use and ESV
Myocardial oxygen consumption (MVO2) varies with the prevailing value of ESV, showing a nadir around 15 ml/m2 (figure 3B), where ESV is given per square metre of body surface area (BSA). For the healthy heart, this optimum corresponds with a sex-specific LVEF around 60 to 65%.7,13 The optimal EF value is what most recent studies emphasise,7 but it would be better to relate survival curves to ESV, as we have documented here and elsewhere.3,12,14
What makes EF (un)attractive?
Every cardiologist knows from their own experience that multiplication of ESV and EDV by the same factor leaves the EF unchanged. The most trivial example refers to indexation of LV volumes for BSA, which mathematical action does not affect the value of EF for the individual patient. This notion can be extended, by comparing all patients having exactly the same EF. For all of them, ONLY the ratio calculated for ESV and EDV is equal. However, these patients are not necessarily the same in terms of ventricular function.12 They are clinically, and from an energetic (or metabolic) standpoint, definitively different, if their LV volumes (ESV and EDV) are not the same.
The notion about the term ESV/EDV also means, as we have seen, that numerous ‘matched measurement errors’ in ESV and EDV yield the same value for EF. Even worse, particular errors in volume measurements may actually improve the apparent agreement for EF between two imaging modalities.11
Independence from BSA is, of course, an asset when selecting EF as a metric. But is it really an advantage, knowing that even the slightest measurement error in ESV and/or EDV may substantially impact the calculated EF?3
Furthermore, absence of any physical unit(s) severely disqualifies EF as a meaningful clinical index. The situation is similar to reporting the ratio of the lowest and highest outside temperature at an unspecified location during an unknown day of the year. A calculated value of 0.783 for this ratio could refer to either Antarctic or tropical areas, as well as anything in between. The single ratio-based value without physical units is meaningless. And, after all, why do we have to calculate the ratio, as the underlying data (in our case ESV and EDV) are available and more informative?
Where is the ‘success’ of EF coming from?
Figures 1 and 3A suggest that EF is fairly associated with ESV. With these and numerous similar figures in mind, it is tempting to state that EF may very well have borrowed its role as a successful player in cardiology from the key variable ESV.1,3,6,7
The future without EF
The calculated value for EF depends on two volume measurements, where the smaller volume (ESV) is divided by the larger one (EDV). Therefore, the resulting EF has no physical unit(s), while its mathematical expression (also when reported in terms of a percentage) makes meaningful statistical evaluations nearly impossible.3 Our commentary primarily concerns criticism about EF, not the technical issues about ESV and EDV, as related to LV geometry, imaging modality, or software packages. Potential errors in ESV and/or EDV measurements remain, even if we abandon EF.
A comprehensive interpretation of the imaging data (ESV and EDV) requires consideration of an additional metric beyond EF.6 Key candidates proposed as improvements for the single use of EF include ESV(i) itself,1,7 and many of its derived metrics (figure 4), including end-systolic elastance (Ees) combined with the volume axis intercept (Vo),14 or stroke work (SW) in combination with (estimated) MVO2.3,13 Note that ESV(i) has a sex-specific reference range, with implications for all associated secondary (derived) metrics.1
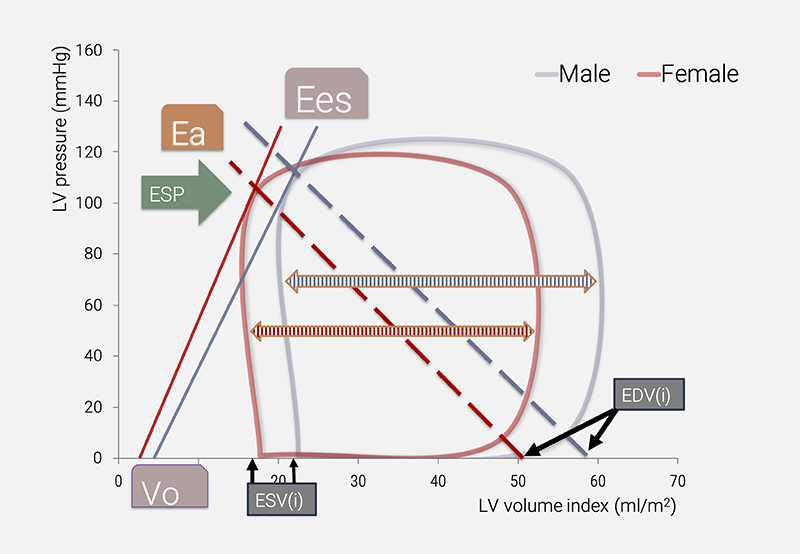
| Key: Ea = arterial elastance; Ees = end-systolic elastance; ESP = end-systolic pressure; ESV(i) = end-systolic volume (index); EDV(i) = end-diastolic volume (index); Vo = volume axis intercept of the Ees line |
Conclusion
EF is a fascinating metric that can easily provide insight into its ratio-based structure, as it refers to only two variables, namely ESV and EDV. In that respect, the EF resembles the cardiothoracic ratio (CTR),3 which was introduced around the time that Bardeen calculated the ratio SV/EDV.4 However, CTR and EF are defined against a different background, implying that the interpretation is completely different. The simplicity of CTR contrasts with the complexity of EF. We have reasoned that considering EF implies relying on a confusing metric. Moreover, calculation of EF is not required when focusing on the fundamental variables ESV and EDV.
In retrospect, it may be appreciated that EF derives its pretended importance from the straightforward association with the key variable ESV, as once more documented in this review. ESV has the advantage of carrying a physical unit, allowing measurements to be expressed in a way that makes comparisons meaningful. The ESV has an optimum value corresponding with lowest predicted MVO2. Below-normal and above-normal values for ESV likely refer to disease states of the ventricle,13 and require comprehensive investigation of the patient. Cardiology without EF will have a bright future when returning to basics.
Key messages
- Debunking the ejection fraction (EF) metric is a somewhat Don Quixotesque effort, as solid publications that perhaps could establish a scientific foundation for considering EF are sorely missing
- The principal weakness of EF resides in the fact that the calculation results in a dimensionless number without unique interpretation
- In contrast, the eminent role of end-systolic volume (ESV) is widely recognised, as this variable forms a central component in various metrics derived from the pressure-volume loop representation
- ESV is the dominant factor in the calculation of EF, which observation readily explains the pretended relevance of EF
Conflicts of interest
None declared.
Funding
None.
References
1. Kerkhof PLM, Kuznetsova T, Yasha Kresh J, Handly N. Cardiophysiology illustrated by comparing ventricular volumes in healthy adult males and females. Adv Exp Med Biol 2018;1065:123–38. https://doi.org/10.1007/978-3-319-77932-4_8
2. Rosano GMC, Teerlink JR, Kinugawa K et al. The use of left ventricular ejection fraction in the diagnosis and management of heart failure. A clinical consensus statement of the Heart Failure Association (HFA) of the ESC, the Heart Failure Society of America (HFSA), and the Japanese Heart Failure Society (JHFS). J Card Fail 2025:S1071-9164(25)00153-8. https://doi.org/10.1016/j.cardfail.2025.03.014
3. Kerkhof PL, Díaz-Navarro R, Heyndrickx GR, Handly N. La serendipia en torno la fracción de eyección: una revisión de la historia, la casualidad y la cuasi-funcionalidad de una métrica aplaudida [A critical analysis of ejection fraction]. Rev Med Chil 2022;150:232–40. https://doi.org/10.4067/S0034-98872022000200232
4. Bardeen CR. Determination of the size of the heart by means of the X-rays. Am J Anat 1918;23:423–87. https://doi.org/10.1002/aja.1000230207
5. Kosaraju A, Goyal A, Grigorova Y, Makaryus AN. Left Ventricular Ejection Fraction. In: StatPearls. Treasure Island (FL): StatPearls Publishing, 2025. Available from: https://europepmc.org/article/nbk/nbk459131
6. Kerkhof PLM, Peace RA, Handly N. Ratiology and a complementary class of metrics for cardiovascular investigations. Physiology (Bethesda) 2019;34:250–63. https://doi.org/10.1152/physiol.00056.2018
7. Kerkhof PLM, Li JK-J, Diaz-Navarro RA et al. Analysis and Interpretation of primary and derived data sets in cardiology. World Scientific Annual Review of Biomechanics 2023;1:2330003. https://doi.org/10.1142/S2810958923300032
8. Foley PW, Chalil S, Khadjooi K, Irwin N, Smith RE, Leyva F. Left ventricular reverse remodelling, long-term clinical outcome, and mode of death after cardiac resynchronization therapy. Eur J Heart Fail 2011;13:43–51. https://doi.org/10.1093/eurjhf/hfq182
9. Moyé LA, Pfeffer MA, Braunwald E; SAVE Investigators. Rationale, design and baseline characteristics of the survival and ventricular enlargement trial. Am J Cardiol 1991;68:70D–79D. https://doi.org/10.1016/0002-9149(91)90263-K
10. Feild BJ, Baxley WA, Russell RO Jr et al. Left ventricular function and hypertrophy in cardiomyopathy with depressed ejection fraction. Circulation 1973;47:1022–31. https://doi.org/10.1161/01.CIR.47.5.1022
11. Kerkhof PLM, Antohi EL, Mihaileanu S. How to evaluate MADness concerning the valvular apparatus? Echocardiography 2025;42:e70173. https://doi.org/10.1111/echo.70173
12. Diaz-Navarro RA, Kerkhof PLM. Cardiac ejection fraction as a problematic metric for heart failure phenotyping. Br J Cardiol 2024;31:45–8. https://doi.org/10.5837/bjc.2024.019
13. Kerkhof PLM, Handly N. Insights from physiology applied to interpretation of supranormal ejection fraction in women (editorial commentary). Eur Heart J Cardiovasc Imaging 2020;21:375–7. https://doi.org/10.1093/ehjci/jeaa018
14. Kerkhof PLM, Li JK, Handly N. Various approaches to define the volume intercept of the ventricular end-systolic pressure-volume relationship: implications for statistical analysis. Annu Int Conf IEEE Eng Med Biol Soc 2022;2022:1398–401. https://doi.org/10.1109/EMBC48229.2022.9871671
