Data have suggested that in vivo cardiac orientation has the greatest effect on the cardiac electric field, and, thus, surface electrical activity. We sought to determine the correlation between in vivo cardiac orientation using cardiac computed tomography (CT) and the electrical cardiac axis in the frontal plane determined by surface electrocardiogram (ECG).
Patients aged between 30 and 60 years old with a normal body mass index (BMI), who underwent CT coronary angiography between July 2010 and December 2012 were included. Patients with diabetes, hypertension, arrhythmias, structural heart disease or thoracic deformities were excluded. In vivo cardiac orientation was determined along the long axis and correlated with the electrical cardiac axis on surface ECG.
There were 59 patients identified, with 47% male, mean age of 49.9 years and a mean BMI of 22.39 kg/m2. The mean cardiac axis on CT was 38.1 ± 7.8°, while the mean electrical cardiac axis on ECG was 51.8 ± 26.6°. Bi-variate analysis found no correlation between the two readings (Pearson r value 0.12, p=0.37).
We conclude, there is no simple relationship between the anatomical cardiac axis and the ECG determined electrical axis of the heart. The electrical axis of the heart, however, showed more variability, reflecting possible underlying conduction disturbances.
Introduction
Due to the asymmetry of the heart, it has long been described in what is known as the ‘Valentine’ position, in which the heart is oriented vertically downwards. It defines the heart as a solitary organ and provides no reference point for its location within the chest. This description has since been found to be inaccurate, as we know the heart is positioned in a direction extending from the right shoulder to the left hypochondrium. The in vivo orientation of the heart takes into account its surrounding bony structures and is the best definition of true anatomical heart position.1,2
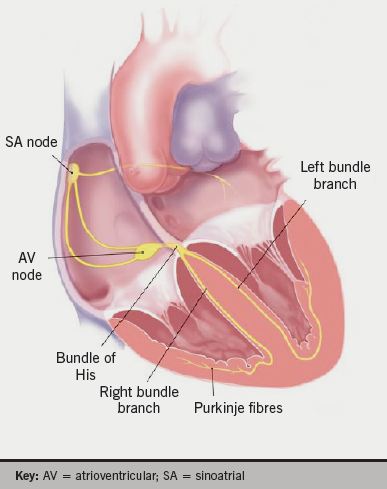
In 1951, Fowler and Braunstein noted a significant association between electrocardiographic and anatomical positions of the heart about the antero-posterior and longitudinal axes, but notably not along the transverse axis. This study used X-ray and angiocardiogram to assess anatomical cardiac position.3 As seen in figure 1, cardiac electrical activation is generated from the sinus node located high in the right atrium and spreads throughout the atria to the atrioventricular node in the infero-posterior region of the interatrial septum. It then enters the base of the ventricle at the bundle of His and follows the left and right bundle branches along the interventricular septum. The pathway of activation described, in approximation, travels along the long axis of the heart. Therefore, an association between the electrocardiographic axis and the anatomical position along the long axis seems feasible.4,5 The electrical cardiac axis on electrocardiogram (ECG), however, represents the mean direction of the electrical action potential during ventricular depolarisation.
A small canine study in 2005 by Arteeva et al. supported Fowler’s findings, and concluded that the orientation of the heart within the thorax affected the formation of the cardiac electric field on the body surface much more than the torso geometry.6 The same year, Engblom et al. conducted a study using cardiac magnetic resonance imaging (CMR) that suggested there was no simple relationship between the electrical and anatomical axes of the heart.7 Therefore, it remains largely unclear whether the electrical cardiac axis and the anatomical cardiac axis are entirely separate entities or whether they are, in fact, related.
We sought to identify in vivo cardiac orientation along the long axis using computed tomography (CT) to calculate an individual’s true anatomical axis. We then subsequently assessed its correlation with their electrical cardiac axis determined on ECG in the
frontal plane.
Methods
This was a retrospective study that included patients who underwent CT coronary angiography (CTCA) at three private radiology centres across Sydney between July 2010 and December 2012.
A Siemens SOMATOM Definition Flash dual-source 128-slice and a General Electric Lightspeed VCT 64-slice CT scanner were both used across the three radiology centres. Six CTs were performed using the 64-slice CT scanner while the remaining were all performed using the 128-slice CT scanner.
Participants
There were 59 patients identified as appropriate for the study. Patients aged between 30 and 60 years old with a normal body mass index (BMI) were included. Normal BMI was defined as between 18.5 kg/m2 and 24.99 kg/m2 according to the World Health Organization (WHO) guidelines.8 Patients with diabetes, hypertension, arrhythmias, structural heart disease or thoracic deformities were excluded. Diabetes and hypertension were defined as any individual on one or more diabetic or anti-hypertensive medications, respectively. Arrhythmias referred to tachyarrhythmias only, and patients were excluded regardless of whether they were paroxysmal or chronic in nature. Patients who had previously had ablative procedures for these tachyarrhythmias were also excluded. Those with congenital or acquired structural heart disease, or thoracic abnormalities were also excluded.
CT analysis

The CT scanning technique used was at the discretion of the radiographers and cardiologists present at the time of the scan. This often adhered to the scanning protocols available at each of the individual radiology centres.
In vivo cardiac orientation was determined along the long axis using Osirix image analysis. Multi-planar reconstruction (MPR) views were used to mark a point at the left ventricular apex and the centre of the mitral annulus. The line connecting these points was marked as the cardiac long axis, as seen in figure 2.
A point at the most distal aspect of the sternum was marked as the xiphisternum. 3D volume-rendered images and axial views were used in conjunction to mark points along the vertebral column. Points were marked along the most posterior aspect of the vertebral foramen, as well as at both junctions of the ribs with the vertebral body at each vertebral level (figures 3 and 4).

The angle of the long axis was measured and subtracted from the bony landmarks to give in vivo cardiac orientation along the long axis.
ECG analysis
A standard 12-lead ECG performed in the frontal plane was obtained for each patient. The majority of patients had ECGs performed within 12 months of the CTCA. Three patients did not have recent ECGs and their most recent ECG was approximately five years prior to their CTCA.
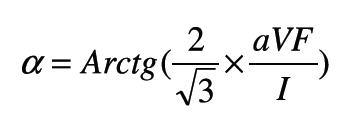
The electrical cardiac axis was determined using the formula below. This formula uses leads I and aVF. The correlation factor in the formula counteracts the inaccuracy created by the difference in the electrical strength of aVF, which is a bipolar lead and lead I which is a unipolar lead.9,10
Statistical analysis

chest with multiple bony and cardiac
structures marked
Bi-variate analysis was performed using SPSS, version 21. The results are all presented as mean ± standard deviation (SD), followed by the range of values in brackets. All axes, both anatomical and electrical are displayed in degrees. The anatomical axis was calculated on Osirix image analysis in radians and subsequently converted to degrees using the formula below:
Degrees = Radians × 180/π
Results
There were 59 patients suitable to be included in the study with similar numbers of men and women, as shown in table 1. Their cardiac profile is also demonstrated in this table. There were no cardiac risk factors in 49% of the patients. The average age was 49.9 ± 7.4 (31–60) years. The average BMI was 22.39 ± 1.75 (18.67–24.88) kg/m2. A double-flash scan was performed in 23 (39%) of the patients, as shown in table 2.


The scatter plot in figure 5 shows the distribution of in vivo cardiac axis on CT and the electrical cardiac axis on ECG. It demonstrates that there is no clear relationship between these two axes.
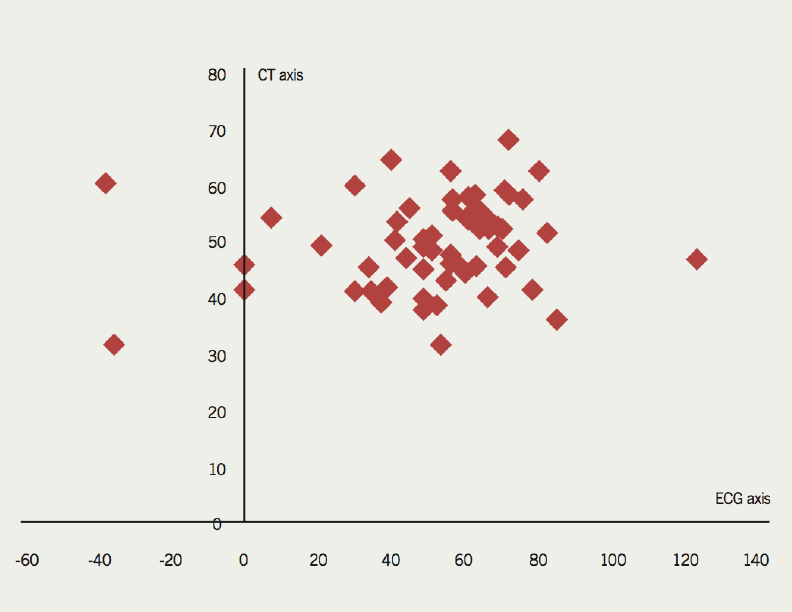

Bi-variate analysis was performed on the data. A Pearson correlation coefficient (r) of 0.12 (p=0.37) and Spearman correlation coefficient (ρ) of 0.16 (p=0.23) confirms that there is no correlation between the in vivo cardiac axis determined on CT and the electrical cardiac axis determined on ECG. The average in vivo cardiac axis on CT was 38.1 ± 7.8° (20.9–56.2°) (figure 6). The average electrical cardiac axis on ECG was 51.8 ± 26.6° (–37.6–125.8°) (figure 7). The calculated in vivo cardiac axis showed significantly less variation compared with the electrical cardiac axis calculated from the ECG.
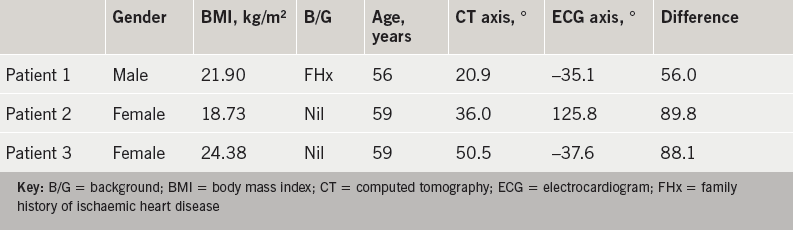
The average difference between the two readings was 24.0 ± 18.0° (0.91–89.79°). Three patients who had the greatest difference between their in vivo cardiac axis and their electrical cardiac axis are detailed in table 3.

Two of these patients had left-axis deviation on their ECG and one patient had right-axis deviation on their ECG. The left-axis deviation measured in the two patients was –35.1° and –37.6°, which corresponded to a CT anatomical axis of 20.9° and 50.5°, respectively. The right-axis deviation measured in patient 2 was 125.8°, which corresponded to a CT anatomical axis of 36.0°. These three patients all had a normal QRS width ranging from 60–100 ms. Of note, both patients with left-axis deviation had abnormalities in their transition zone. One had a delayed transition zone, while the other had evidence of R-wave regression. Patient 2 with the right-axis deviation had no electrocardiographic abnormalities of their transition zone. The remaining patients all had an electrical cardiac axis within the normal range (–30° to 90°).
Discussion
Our study suggests that there is no correlation between in vivo cardiac orientation and the ECG-determined electrical cardiac axis. The in vivo cardiac orientation refers to the true anatomical cardiac axis, which accounts for its surrounding structures. The electrical cardiac axis, however, represents the mean direction of the electrical action potential during ventricular depolarisation. It has previously been thought that the anatomical position of the heart would be reflected in the electrical cardiac axis. Our study, however, suggests that there is no simple relationship between these two axes in healthy, young to middle-aged individuals. Although, it certainly seems plausible that changes in the anatomical cardiac axis would result in changes in the electrical cardiac axis, there does not appear to be a simple measure of how exactly this occurs.
The mean in vivo cardiac axis calculated on CT was 38.1°. There was little variability around this measurement, suggesting this is a good approximation of the in vivo cardiac axis in young to middle-aged healthy individuals. The mean electrical axis calculated on ECG was 51.8°. There was, however, a great deal more variability in the calculated electrical cardiac axis. This is suspected to be due to variations in the pathway of cardiac activation due to subclinical conduction disturbances.
Intra-individual variability of ECGs has been described in detail by Schijvenaars et al. Limb-lead interchanges are quite common and also, unfortunately, quite difficult to recognise on ECG. He, nevertheless, concludes that intra-individual variability seems to contribute less to ECG readings when compared with inter-individual variables such as age, obesity and sex.11-16 In our series, we used young to middle-aged individuals between the ages of 30 and 60 years old. Our study used patients with a normal BMI based on the WHO guidelines. The WHO guidelines for the definition of a normal BMI are the same for different ages and sex, although some debate has been raised as to whether these values need to be modified for Asian and Pacific populations. This was, however, studied by the committee and it was concluded that the guidelines should remain unchanged as international classification for all ethnic groups.5 There was also an approximate equal distribution of men and women in our study, which should potentially avoid any significant biases based on gender.
Thus, assuming any potential inaccuracies of ECG recordings are negligible, the variability noted in the electrical cardiac axis may, in fact, be due to subclinical conduction disturbances. These conduction disturbances can delay intra-cardiac conduction and alter the course of the cardiac action potential. This, in turn, may cause a change in the electrical cardiac axis. However, our study shows that these changes in the electrical cardiac axis are not necessarily reflected in changes in the true anatomical cardiac axis.
Additionally, Foster et al. used CMR to determine the effects of respiration and cardiac cycle changes on the left ventricular long axis. Although his study had relatively small numbers, it concluded that these variables did not contribute significantly to the long axis orientation.16,17
Variations in the transitional zone on ECG were noted in those with a left electrical cardiac axis. A left-axis deviation was seen with a delayed transition zone in one patient, and with R-wave regression in another. A delayed transition zone was identified as a shift of the transitional zone to the left, beyond lead V4. The shift of the transitional zone to the left precordial leads is generally referred to as a clockwise rotation of the heart, which is a widely accepted definition.3,18-21 Tahara et al. used cardiac CT to describe that a shift in the transitional zone is associated with an anatomical rotation about the long axis in approximately two-thirds of people.22 His study, however, did not explore the relationship between the transition zone and the electrical cardiac axis.
Two of the major limitations of this study were the small sample size and the retrospective study design. The small sample size was predominantly due to the narrow inclusion and exclusion criteria used. This is attributable to the fact that it is uncommon for relatively well individuals without significant cardiac problems or risk factors to have a CTCA performed.
Conclusion
Our study suggests that there is no correlation between the in vivo anatomical cardiac axis and the electrical cardiac axis in healthy young to middle-aged individuals. The electrical cardiac axis was, however, found to be subject to a greater degree of variability, and this is thought to be due to subclinical conduction disturbances. The study also raises the possibility of an association between a shift in the transitional zone on ECG and the electrical cardiac axis. Further studies with larger numbers are warranted to support these findings.
Acknowledgements
This abstract has been presented at CSANZ New Zealand, 2013 and at SCCT Montreal, 2013.
Funding
This research received no grant from any funding agency in the public, commercial or not-for-profit sectors.
Conflict of interest
None declared.
Key messages
- In vivo cardiac orientation is a more accurate definition of the anatomical position of the heart
- There is no simple relationship between the anatomical and electrical cardiac axis of the heart in young to middle-aged healthy individuals
- There was more variability in the electrical cardiac axis, possibly due to underlying conduction abnormalities
- There may be a relationship between the transition zone and the cardiac electrical axis
References
1. Partridge JB, Anderson RH. Left ventricular anatomy: its nomenclature, segmentation, and planes of imaging. Clin Anat 2009;22:77–84. http://dx.doi.org/10.1002/ca.20646
2. Anderson RH, Loukas, M. The importance of attitudinally appropriate description of cardiac anatomy. Clin Anat 2009;22:47–51. http://dx.doi.org/10.1002/ca.20741
3. Fowler NO, Braunstein JR. Anatomic and electrocardiographic position of the heart. Circulation 1951;3:906–10. http://dx.doi.org/10.1161/01.CIR.3.6.906
4. Boineau JP, Spach MS. The relationship between the electrocardiogram and the electrical activity of the heart. J Electrocardiol 1968;1:117–24. http://dx.doi.org/10.1016/S0022-0736(68)80014-7
5. Pullan AJ, Buist ML, Sands GB, Cheng LK, Smith NP. Cardiac electrical activity – from heart to body surface and back again. J Electrocardiol 2003;36(suppl):63–7. http://dx.doi.org/10.1016/j.jelectrocard.2003.09.016
6. Arteeva NV, Roshcevskaya M, Vityazev VA, Shmakov DN, Roshchevskii MP. Effect of torso shape and heart location in the chest on formation of cardiac electric potentials on body surface in dogs. Bull Exp Biol Med 2005;140:165–7. http://dx.doi.org/10.1007/s10517-005-0435-7
7. Engblom H, Foster JE, Martin TN et al. The relationship between electrical axis by 12-lead electrocardiogram and anatomical axis of the heart by cardiac magnetic resonance in healthy subjects. Am Heart J 2005;150:507–12. http://dx.doi.org/10.1016/j.ahj.2004.10.041
8. World Health Organization. Global database on body mass index. Available from: http://www.who.int/bmi/index.jsp [accessed June 2009].
9. Hoseini SS, Moeeny A, Shoar S et al. Designing nomogram for determining the heart’s QRS axis. J Clin Basic Cardiol 2011;14:12–15. Available from: http://www.kup.at/kup/pdf/10452.pdf
10. Hancock EW, Deal BJ, Mirvis DM, Okin P, Kligfield P, Gettes LS. AHA/ACCF/HRS recommendations for the standardization and interpretation of the electrocardiogram. Part V: electrocardiogram changes associated with cardiac chamber hypertrophy: a scientific statement from the American Heart Association Electrocardiography and Arrhythmias Committee, Council on Clinical Cardiology; the American College of Cardiology Foundation; and the Heart Rhythm Society. Endorsed by the International Society for Computerized Electrocardiology. J Am Coll Cardiol 2009;53:992–1002. http://dx.doi.org/10.1016/j.jacc.2008.12.015
11. Schijvenaars BJA, Gerard van Herpen P, Kors JA. Intraindividual variability in electrocardiograms. J Electrocardiol 2008;41:190–6. http://dx.doi.org/10.1016/j.jelectrocard.2008.01.012
12. Hoekema R, Uijen GJ, van Erning L, van Oosterom A. Interindividual variability of multilead electrocardiographic recordings – influence of heart position. J Electrocardiol 1999;32:137–48. http://dx.doi.org/10.1016/S0022-0736(99)90092-4
13. van Oosterom A, Hoekema R, Uijen GJ. Geometrical factors affecting the interindividual variability of the ECG and the VCG. J Electrocardiol 2000;33(suppl 1):219–27. http://dx.doi.org/10.1054/jelc.2000.20356
14. Wenger W, Kligfield P. Variability of precordial electrode placement during routine electrocardiography. J Electrocardiol 1996;29:179–84. http://dx.doi.org/10.1016/S0022-0736(96)80080-X
15. Peberdy MA, Ornato JP. Recognition of electrocardiographic lead misplacements. Am J Emerg Med 1993;11:403–05. http://dx.doi.org/10.1016/0735-6757(93)90177-D
16. Foster JE, Engblom H, Thomas NM et al. Determination of left ventricular long-axis orientation using MRI: changes during the respiratory and cardiac cycles in normal and diseased subjects. Clin Physiol Funct Imaging 2005;25:286–92. http://dx.doi.org/10.1111/j.1475-097X.2005.00624.x
17. Hoffman EA, Ritman EL. Shape and dimensions of cardiac chambers: Importance of CT section thickness and orientation. Radiology 1985;155:739–44. http://dx.doi.org/10.1148/radiology.155.3.400137
18. Goldberger E. Unipolar lead electrocardiography and vectorcardiography. Philadelphia: Lea & Febiger, 1953.
19. Goldberger E. Effect of clockwise rotation of the heart on the electrocardiogram. Am J Med 1949;7:756–9. http://dx.doi.org/10.1016/0002-9343(49)90414-3
20. Goldman MJ. Principles of clinical electrocardiography. 11th edition. Los Altos: Lange Medical Publications, 1982.
21. Cooksey JD, Dunn M, Masae E. Clinical vectorcardiography and electrocardiography. 2nd edition. Chicago: Year Book Medical Publishers, 1977.
22. Tahara Y, Mizuna H, Ono A, Ishikawa K. Evaluation of the electrocardiographic transitional zone by cardiac computed tomography. J Electrocardiol 1991;24:239–45. http://dx.doi.org/10.1016/0022-0736(91)90029-L
