The coronavirus disease 2019 (COVID-19) commonly involves the respiratory system but increasingly cardiovascular involvement is recognised. We assessed electrocardiogram (ECG) abnormalities in patients with COVID-19.
We performed retrospective analysis of the hospital’s COVID-19 database from April to May 2020. Any ECG abnormality was defined as: 1) new sinus bradycardia; 2) new/worsening bundle-branch block; 3) new/worsening heart block; 4) new ventricular or atrial bigeminy/trigeminy; 5) new-onset atrial fibrillation (AF)/atrial flutter or ventricular tachycardia (VT); and 6) new-onset ischaemic changes. Patients with and without any ECG change were compared.
There were 455 patients included of whom 59 patients (12.8%) met criteria for any ECG abnormality. Patients were older (any ECG abnormality 77.8 ± 12 years vs. no ECG abnormality 67.4 ± 18.2 years, p<0.001) and more likely to die in-hospital (any ECG abnormality 44.1% vs. no ECG abnormality 27.8%, p=0.011). Cox-proportional hazard analysis demonstrated any ECG abnormality (hazard ratio [HR] 1.97, 95% confidence interval [CI] 1.12 to 3.47, p=0.019), age (HR 1.03, 95%CI 1.01 to 1.05, p=0.0009), raised high sensitivity troponin I (HR 2.22, 95%CI 1.27 to 3.90, p=0.006) and low estimated glomerular filtration rate (eGFR) (HR 1.73, 95%CI 1.04 to 2.88, p=0.036) were independent predictors of in-hospital mortality.
In conclusion, any new ECG abnormality is a significant predictor of in-hospital mortality.
Introduction
The coronavirus disease 2019 (COVID-19) caused by severe acute respiratory syndrome coronavirus 2 (SARS-CoV-2), emerged in Wuhan China and has since spread to over 180 countries.1 It was declared a pandemic by the World Health Organization (WHO) in March 2020.
In addition to the common respiratory clinical presentation, COVID-19 is associated with cardiovascular complications, which may contribute to patients’ demise.2 The most common is myocardial injury, indicated by a serum troponin rise, which has also been found to be a reliable indicator of disease severity.3 Cardiac arrhythmia is another common cardiovascular manifestation. In hospitalised COVID-19 patients, atrial arrhythmia was noted in 7.4% of 393 patients in an American cohort and was more common in invasive mechanical ventilated patients compared with non-invasive mechanical ventilated patients (18.5% vs. 1.9%).4
Currently, there remain limited data on details of electrocardiogram (ECG) abnormalities in patients with COVID-19.5,6 We aimed to assess details of ECG abnormalities, management and outcomes in patients presenting with COVID-19 to our centre.
Method
We performed retrospective observational analysis of COVID-positive patients admitted at Sandwell and West Birmingham Hospitals between April 2020 and May 2020. This study was approved by the local governance department and followed the principles of the Declaration of Helsinki.7 The study also adhered to “Strengthening the Reporting of Observational Studies in Epidemiology (STROBE) statement: guidelines for reporting observational studies”.8
The following patients were excluded from analysis:
- <18 years old
- outpatients who were COVID-19 positive (in the community)
- patients admitted to other hospitals (separate from those mentioned above)
- patients who did not have an ECG on or after admission
- patients whose ECGs were not scanned to our electronic patient records (EPRs).
ECGs were reviewed by MY (registrar) and VS (consultant). The ECG parameters recorded were: rate, PR-interval, QRS duration and corrected QT-interval obtained from automated ECG analysis; rhythm and ischaemic changes were obtained from automated analysis and visual assessment. In case of disagreement, both MY and VS reviewed the ECGs together and came to a consensus.
The peri-admission ECG was considered abnormal if at least one of the following criteria were met, and there was a comparative previous ECG (performed in the last three years) to confirm it was a new change.
Definition of ‘any ECG abnormality’:
- new sinus bradycardia in the absence of rate-slowing medications
- new or worsening bundle-branch block (BBB) (QRS >120 ms plus other standard ECG criteria for right or left BBB; worsening of the BBB indicated by increase in QRS duration from baseline of >120 ms plus other standard ECG criteria for BBB)
- new or worsening heart block
- new ventricular bigeminy/trigeminy or atrial bigeminy/trigeminy
- new-onset atrial fibrillation (AF)/atrial flutter or ventricular tachycardia (VT)
- new-onset ischaemic changes (ST-elevation, ST-depression or T-wave inversion).
Demographic data, blood tests, details of ECGs and echocardiography (where available) performed, cardiology review/management plan and outcome data (in-hospital mortality and intensive care unit [ITU] admission) were collected from EPR.
Statistical analysis
Data were analysed using the MedCalc@ statistical software. Continuous variables are presented as mean (± standard deviation [SD]) and compared using the student t-test or single-factor ANOVA (analysis of variance). Categorical variables are presented as percentages and compared using Chi-square or Fisher’s test.
Univariate analysis for demographics, blood tests and outcomes was performed between those with and without any new ECG abnormality and between non-survivors and survivors.
Hazard ratio (HR) for predictors of mortality was based on a Cox-regression model and reported as effect size. The predictive ability of the model was assessed by c-statistic.
Results
Out of 661 patients, 455 patients met the inclusion criteria (figure 1). The overall mean age (± SD) was 68.8 (± 17.8) years and 147 (32.3%) were of Black or South Asian ethnicity.
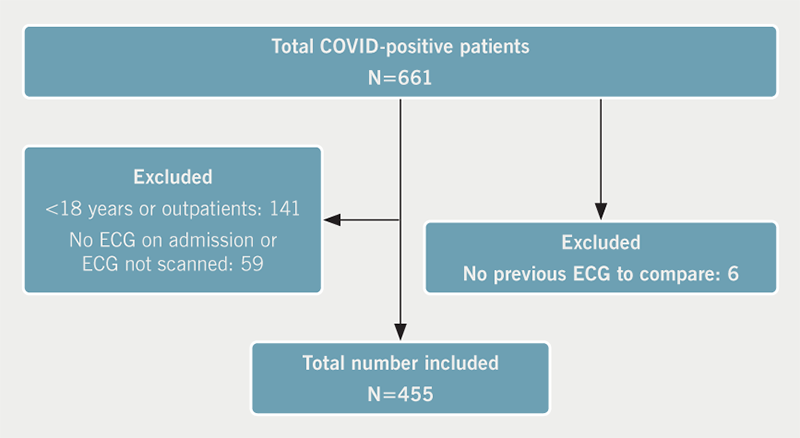
New ECG abnormalities were observed in 59 patients (13%) (table 1). There were 396 patients (87.0%) that did not meet the criteria for any new ECG abnormality (normal 202, sinus tachycardia 136, old changes 58).
Table 1. Baseline and electrocardiogram (ECG) characteristics and outcomes of patients based on ECG
| Variable | Any ECG abnormality N=59 |
No ECG abnormality N=396 |
Significance p value |
|---|---|---|---|
| Mean age, years | 77.8 ± 12 | 67.4 ± 18.2 | p<0.001 |
| Female gender, n (%) | 26 (44.1%) | 183 (46.2%) | p=0.76 |
| Hypertension, n (%) | 38 (64.4%) | 195 (49.2%) | p=0.03 |
| Diabetes, n (%) | 27 (45.8%) | 139 (35.1%) | p=0.11 |
| Smoker, n (%) (N=433) | 13 (22.4%) | 53 (14.1%) | p=0.10 |
| COPD, n (%) | 7 (11.9%) | 50 (12.6%) | p=0.87 |
| Previous IHD, n (%) | 11 (18.6%) | 54 (13.4%) | p=0.31 |
| Previous MI, n (%) | 4 (6.8%) | 14 (3.5%) | p=0.23 |
| Previous PCI, n (%) | 4 (6.8%) | 17 (4.3%) | p=0.40 |
| Previous CABG, n (%) | 2 (3.4%) | 4 (1%) | p=0.14 |
| Mean haemoglobin, g/L (N=453) | 129.4 ± 48.9 | 129.5 ± 21.8 | p=0.31 |
| Mean lymphocyte count x 109/L (N=453) | 0.97 ± 0.64 | 1.16 ± 0.95 | p=0.05 |
| Mean hsTnI, ng/L (N=323) | 1,475.95 ± 5,757 | 157.9 ± 1,173 | p<0.001 |
| Mean raised hsTnI, ng/L (N=299) | 1,510.2 ± 5,820 | 171.9 ± 1,224.1 | p<0.001 |
| Raised hsTnI, n (%) (N=299) | 33/43 (76.7%) | 114/256 (44.5%) | p=0.0001 |
| Mean D-dimer, µgFEU/ml (N=64) | 4.9 ± 7.1 | 9.7 ± 22.3 | p=0.83 |
| Mean ferritin, µg/L (N=310) | 973.2 ± 1,129.5 | 1,071.3 ± 1,525.5 | p=0.50 |
| Mean eGFR, ml/min/1.73 m2 (N=454) | 48.91 ± 24.9 | 60.0 ± 25.0 | p=0.003 |
| eGFR ≤30 ml/min/1.73 m2, n (%) (N=454) | 15 (25.4%) | 59 (14.9%) | p=0.04 |
| Mean magnesium, mmol/L (N=322) | 0.89 ± 0.15 | 0.85 ± 0.17 | p=0.16 |
| Echocardiogram performed, n (%) | 7 (11.9%) | 34 (8.7%) | p=0.05 |
| ITU admission, n (%) | 8 (13.6%) | 37 (9.3%) | p=0.31 |
| Died in hospital, n (%) | 26 (44.1%) | 110 (27.8%) | p=0.011 |
| Cardiology referral, n (%) | 6 (10.2%) | 11 (2.8%) | p=0.005 |
| Mean heart rate, bpm | 99.5 ± 29.1 | 93.4 ± 18.7 | p=0.17 |
| Mean PR-interval, ms | 88.5 ± 91.6 | 137.2 ± 53.2 | p<0.001 |
| Mean QRS-interval, ms | 109.7 ± 52.7 | 96.9 ± 19.1 | p=0.001 |
| Mean QTc-interval, ms | 408.9 ± 37.5 | 402.8 ± 30.8 | p=0.22 |
| ECG changes*, n | |||
| No change | – | 396 | – |
| New sinus bradycardia | 3 | – | – |
| New or worsening BBB | 7 | – | – |
| New or worsening heart block | 2 | – | – |
| New atrial/ventricular bigeminy/trigeminy | 4 | – | – |
| New atrial fibrillation | 33 | – | – |
| Ischaemic changes | 10 | – | – |
| *Some patients had more than one type of ECG abnormality. Key: BBB = bundle-branch block; CABG = coronary artery bypass graft surgery; COPD = chronic obstructive pulmonary disease; eGFR = estimated glomerular filtration rate; hsTnI = high-sensitivity troponin I; IHD = ischaemic heart disease; ITU = intensive care unit; MI = myocardial infarction; PCI = percutaneous coronary intervention |
|||
Patients with any ECG abnormality were significantly older, with hypertension (HTN) and more likely to die in-hospital (table 1, univariate analysis). New-onset AF was the most common ECG abnormality (table 2).
Table 2. Baseline and ECG characteristics of non-survivors and survivors
| Variable | Non-survivor N=136 |
Survivor N=319 |
Significance p value |
|---|---|---|---|
| Mean age, years | 78.5 ± 12.1 | 64.6 ± 18.3 | p<0.001 |
| Female gender, n (%) | 60 (44.1%) | 149 (46.7%) | p=0.61 |
| Hypertension, n (%) | 84 (61.8%) | 149 (46.7%) | p=0.003 |
| Diabetes, n (%) | 63 (46.3%) | 103 (32.3%) | p=0.005 |
| Smoker, n (%) (N=433) | 24 (18.5%) | 42 (13.9%) | p=0.22 |
| COPD, n (%) | 19 (14.0%) | 38 (11.9%) | p=0.54 |
| Previous IHD, n (%) | 24 (17.6%) | 41 (12.9%) | p=0.18 |
| Previous MI, n (%) | 6 (4.4%) | 12 (3.8%) | p=0.75 |
| Previous PCI, n (%) | 8 (5.9%) | 13 (4.1%) | p=0.40 |
| Previous CABG, n (%) | 4 (2.9%) | 2 (0.6%) | p=0.05 |
| Mean haemoglobin, g/L (N=453) | 127.1 ± 24.5 | 130.5 ± 27.8 | p=0.15 |
| Mean lymphocyte count x 109/L (N=453) | 1.06 ± 0.9 | 1.16 ± 0.93 | p=0.09 |
| Mean hsTnI, ng/L (N=323) | 715.3 ± 3,698.8 | 165.3 ± 1,481.4 | p≤0.001 |
| Mean raised hsTnI, ng/L (N=299) | 722.4 ± 3,716.7 | 184.5 ± 1,564.3 | p<0.001 |
| Raised hsTnI, n (%) (N=299) | 77/100 (77.0%) | 70/199 (35.2%) | p=0.0001 |
| Mean D-dimer, ugFEU/ml (N=64) | 17.6 ± 31.4 | 4.1 ± 8.4 | p≤0.01 |
| Mean ferritin, µg/L (N=310) | 1,279.2 ± 1,464 | 964.6 ± 1480.6 | p=0.003 |
| Mean eGFR, ml/min/1.73 m2 (N=454) | 49.2 ± 24.2 | 62.6 ± 24.6 | p<0.001 |
| eGFR ≤30 ml/min/1.73 m2, n (%) (N=454) | 31 (23.0%) | 43 (13.5%) | p=0.01 |
| Mean magnesium, mmol/L (N=322) | 0.89 ± 0.20 | 0.84 ± 0.15 | p=0.03 |
| Echocardiogram performed, n (%) | 12 (8.8%) | 29 (9.1%) | p=0.5 |
| ITU admission, n (%) | 19 (14.0%) | 26 (8.2%) | p=0.06 |
| Any ECG abnormality, n (%) | 26 (19.1%) | 33 (10.3%) | p=0.01 |
| Cardiology referral, n (%) | 4 (2.9%) | 13 (4.1%) | p=0.56 |
| Mean heart rate, bpm | 95.6 ± 22.5 | 93.6 ± 19.5 | p=0.41 |
| Mean PR-interval, ms | 124.3 ± 71.7 | 133.6 ± 56.7 | p=0.02 |
| Mean QRS-interval, ms | 101.8 ± 37.5 | 97.1 ± 19.5 | p=0.08 |
| Mean QTc-interval, ms | 407.8 ± 32.3 | 401.8 ± 31.4 | p=0.075 |
| ECG changes*, n | |||
| No change | 110 | 286 | – |
| New sinus bradycardia | 1 | 2 | – |
| New or worsening BBB | 2 | 5 | – |
| New or worsening heart block | 2 | 0 | – |
| New atrial/ventricular bigeminy/trigeminy | 0 | 4 | – |
| New atrial fibrillation | 16 | 17 | – |
| Ischaemic changes | 5 | 5 | – |
| *Some patients had more than one type of ECG abnormality. Key: BBB = bundle-branch block; CABG = coronary artery bypass graft surgery; COPD = chronic obstructive pulmonary disease; eGFR = estimated glomerular filtration rate; hsTnI = high-sensitivity troponin I; IHD = ischaemic heart disease; ITU = intensive care unit; MI = myocardial infarction; PCI = percutaneous coronary intervention |
|||
High-sensitivity troponin I (hsTnI) was significantly elevated in those with any ECG abnormality (table 1), and in those who did not survive (table 2). Similarly, a low estimated glomerular filtration rate (eGFR) was more frequent in those with any ECG abnormality (table 1) and in those who did not survive (table 2). Other univariate analyses are presented in tables 1 and 2. There was no correlation between ethnicity, troponin levels and previous ischaemic heart disease (supplementary data).
Cox-proportional analysis (stepwise) to assess predictors of in-hospital mortality was performed with the following significant univariate variables: age, HTN, diabetes mellitus (DM) and any ECG abnormality plus the significant blood test results (raised hsTnI, eGFR ≤30 ml/min/1.73 m2, serum ferritin and serum magnesium – available for at least 65% of the cohort). Any ECG abnormality predicted in-hospital mortality (HR 1.97, 95% confidence interval [CI] 1.12 to 3.47, p=0.019) (figure 2). The other predictors of mortality were: age, raised hsTnI and low eGFR (age: HR 1.03, 95%CI 1.01 to 1.05, p=0.0009; raised hsTnI: HR 2.22, 95%CI 1.27 to 3.90, p=0.006; low eGFR: HR 1.73, 95%CI 1.04 to 2.88, p=0.036) (table 3). The c-statistic of the model was 0.779 (p<0.001).
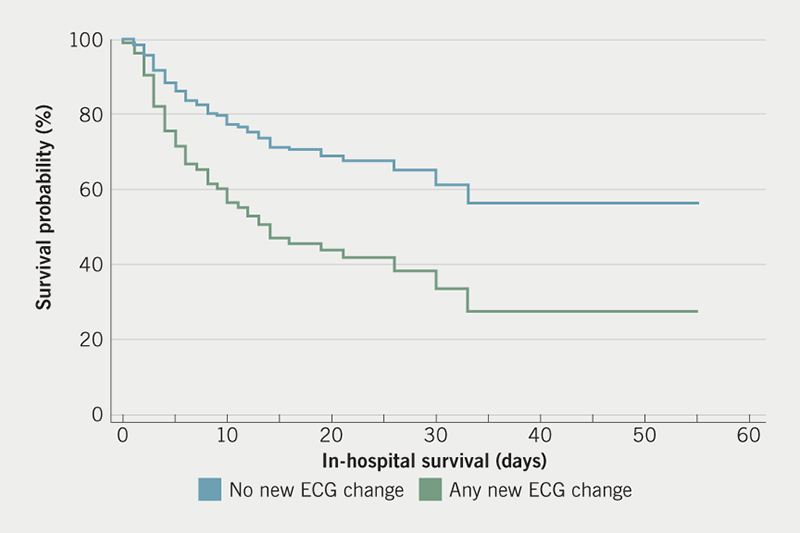
Table 3. Adjusted predictors of mortality
| Independent variable | Hazard ratio | 95% confidence interval | Significance p value |
|
|---|---|---|---|---|
| Lower bound | Upper bound | |||
| Age | 1.03 | 1.01 | 1.05 | p=0.0009 |
| Raised hsTnI | 2.22 | 1.27 | 3.90 | p=0.006 |
| Low eGFR | 1.73 | 1.04 | 2.88 | p=0.036 |
| Any ECG abnormality | 1.97 | 1.12 | 3.47 | p=0.019 |
| Key: ECG = electrocardiogram; eGFR = estimated glomerular filtration rate; hsTnI = high-sensitivity troponin I | ||||
Discussion
We present a detailed analysis of ECG abnormalities in hospitalised COVID-19 patients. New-onset AF was the most common ECG abnormality. Any ECG abnormality was an independent predictor of death.
There are limited data regarding detailed analysis of ECG abnormalities in COVID-19 patients and ours is one of the first studies to characterise this. New-onset AF was the most common arrhythmia noted in our patient cohort, including those admitted to ITU. Goyal et al. demonstrated an increased incidence of atrial arrhythmias in hospitalised patients with COVID-19, especially those admitted to ITU.4 A similar trend was demonstrated by Wang et al.; 16.7% of their COVID-19 patient cohort had a diagnosis of arrhythmia, being more frequent in those patients admitted to ITU.9 Malignant or fatal arrhythmias were not observed in our patient cohort, unlike in the patient population described by Si et al., where patients had fatal ventricular tachycardia or ventricular fibrillation,10 which could also be secondary to medications (e.g. chloroquine or ritonavir) or pre-existing liver/renal disease.11,12
ST/T-wave changes occur in patients with COVID-19 secondary to myo-pericarditis, pulmonary embolism, hypoxia or inflammatory change.11,13,14 Haseeb et al. have proposed that presence of ST/T abnormalities in the course of a febrile illness during this pandemic should trigger investigation for COVID-19.11 In contrast, only a small proportion of our cohort developed ST/T changes. ECG abnormalities and arrhythmias in our study patients could be secondary to ongoing critical illness, but myocardial injury can result from cytokine-induced systemic inflammation,3 as a consequence of the SARS-CoV-2 potentially infecting cardiac myocytes, pericytes and fibroblasts via the angiotensin-converting enzyme (ACE) 2 pathway.15 This might also explain the prolonged QRS duration in our study, itself an independent predictor of poor outcome, indicative of worsening left ventricular (LV) function.16 A limited number of patients had concomitant echocardiography performed, and we hypothesise that this QRS prolongation may be related to LV impairment.
Fulminant myocarditis in confirmed COVID-19 patients, although reported,17,18 was not seen in our patient cohort. Cardiac injury (indicated by a raised troponin) is common in patients with COVID-19, and is associated with increased in-hospital mortality.19 Guo et al.20 demonstrated that COVID-19 patients with raised troponin, even in the absence of underlying cardiovascular disease, had reduced in-hospital survival. Raised troponin as a poor prognostic marker is not unique to COVID-19 and predicts poor outcomes even in non-cardiac patients.21,22
Systemic hyper-inflammation occurs as a host response to COVID-19.23 Expectantly, acute phase reactants (serum ferritin, C-reactive protein) will be raised. In addition, serum ferritin has also been identified as an independent marker of disease severity in COVID-19 patients,24 as was seen in our patient cohort. Increased mortality rate was seen with increasing age by Verity et al. in an individual case-based study on COVID-19 patients.25 Age was also an independent predictor of in-hospital mortality in our study.
In-hospital mortality in our patients with any ECG abnormality was >1.5 times higher compared with those with no ECG change. The presence of pre-existing ECG abnormalities is known to be associated with increased in-hospital mortality.26
Limitations
Our study has some limitations. This is a retrospective observational study from a single centre. Some patients had already been hospitalised prior to their diagnosis of COVID-19. These patients’ underlying primary diagnosis could have confounded the new ECG changes. In addition, the older age of the population may bias some of the ECG changes, especially AF. Only a proportion of patients had a complete set of blood tests, hence, all biochemical markers were not included in the Cox-hazard analysis. Finally, not all patients had an echocardiogram performed. Correlation of ECG change, troponin elevation and LV function on echocardiography may have helped better delineate ECG changes. For definite conclusions, a larger cohort or multi-centre analysis is required.
Conclusion
We characterised new ECG abnormalities in hospitalised COVID-19 patients and demonstrated a low incidence of new ECG changes. Any new ECG abnormality was predictive of in-hospital mortality. AF was the most common new ECG abnormality seen.
Key messages
- A low incidence of new electrocardiogram (ECG) abnormalities is seen in hospitalised COVID-19 patients
- Any new ECG change is associated with poor outcome
Conflicts of interest
None declared.
Funding
None.
Study approval
This study was approved by the local governance department and followed the principles of the Declaration of Helsinki.7 The study also adhered to “Strengthening the Reporting of Observational Studies in Epidemiology (STROBE) statement: guidelines for reporting observational studies”.8
References
1. Zhu N, Zhang D, Wang W et al. A novel coronavirus from patients with pneumonia in China, 2019. N Engl J Med 2020;382:727–33. https://doi.org/10.1056/NEJMoa2001017
2. Ruan Q, Yang K, Wang W, Jiang L, Song J. Clinical predictors of mortality due to COVID-19 based on an analysis of data of 150 patients from Wuhan, China. Intensive Care Med 2020;46:846–8. https://doi.org/10.1007/s00134-020-05991-x
3. Zhou F, Yu T, Du R et al. Clinical course and risk factors for mortality of adult inpatients with COVID-19 in Wuhan, China: a retrospective cohort study. Lancet 2020;395:1054–62. https://doi.org/10.1016/S0140-6736(20)30566-3
4. Goyal P, Choi JJ, Pinheiro LC et al. Clinical characteristics of Covid-19 in New York City. N Engl J Med 2020;382:2372–4. https://doi.org/10.1056/NEJMc2010419
5. Driggin E, Madhavan MV, Bikdeli B et al. Cardiovascular considerations for patients, health care workers, and health systems during the coronavirus disease 2019 (COVID-19) pandemic. J Am Coll Cardiol 2020;75:2352–71. https://doi.org/10.1016/j.jacc.2020.03.031
6. Kochi AN, Tagliari AP, Forleo GB, Fassini GM, Tondo C. Cardiac and arrhythmic complications in patients with COVID-19. J Cardiovasc Electrophysiol 2020;31:1003–08. https://doi.org/10.1111/jce.14479
7. World Medical Association. World Medical Association Declaration of Helsinki: ethical principles for medical research involving human subjects. JAMA 2013;310:2191–4. https://doi.org/10.1001/jama.2013.281053
8. von Elm E, Altman DG, Egger M et al. The Strengthening the Reporting of Observational Studies in Epidemiology (STROBE) statement: guidelines for reporting observational studies. Ann Intern Med 2007;147:573–7. https://doi.org/10.7326/0003-4819-147-8-200710160-00010
9. Wang D, Hu B, Hu C et al. Clinical characteristics of 138 hospitalized patients with 2019 novel coronavirus-infected pneumonia in Wuhan, China. JAMA 2020;323:1061–9. https://doi.org/10.1001/jama.2020.1585
10. Si D, Du B, Ni L et al. Death, discharge and arrhythmias among patients with COVID-19 and cardiac injury. CMAJ 2020;192:E791–E798. https://doi.org/10.1503/cmaj.200879
11. Haseeb S, Gul EE, Çinier G et al. Value of electrocardiography in coronavirus disease 2019 (COVID-19). J Electrocardiol 2020;62:39–45. https://doi.org/10.1016/j.jelectrocard.2020.08.007
12. Szekely Y, Lichter Y, Shrkihe BA, Bruck H, Oster HS, Viskin S. Chloroquine-induced torsades de pointes in a patient with coronavirus disease 2019. Heart Rhythm 2020;17:1452–5. https://doi.org/10.1016/j.hrthm.2020.04.046
13. Casey K, Iteen A, Nicolini R, Auten J. COVID-19 pneumonia with hemoptysis: acute segmental pulmonary emboli associated with novel coronavirus infection. Am J Emerg Med 2020;38:1544.e1–1544.e3. https://doi.org/10.1016/j.ajem.2020.04.011
14. Fried JA, Ramasubbu K, Bhatt R et al. The variety of cardiovascular presentations of COVID-19. Circulation 2020;141:1930–6. https://doi.org/10.1161/CIRCULATIONAHA.120.047164
15. Hendren NS, Drazner MH, Bozkurt B, Cooper LT. Description and proposed management of the acute COVID-19 cardiovascular syndrome. Circulation 2020;141:1903–14. https://doi.org/10.1161/CIRCULATIONAHA.120.047349
16. Wang NC, Maggioni AP, Konstam MA et al. Clinical implications of QRS duration in patients hospitalized with worsening heart failure and reduced left ventricular ejection fraction. JAMA 2008;299:2656–66. https://doi.org/10.1001/jama.299.22.2656
17. Hu H, Ma F, Wei X, Fang Y. Coronavirus fulminant myocarditis saved with glucocorticoid and human immunoglobulin. Eur Heart J 2021;42:191. https://doi.org/10.1093/eurheartj/ehaa190
18. Zeng JH, Liu YX, Yuan J et al. First case of COVID-19 complicated with fulminant myocarditis: a case report and insights. Infection 2020;48:773–7. https://doi.org/10.20944/preprints202003.0180.v1
19. Shi S, Qin M, Shen B et al. Association of cardiac injury with mortality in hospitalized patients with COVID-19 in Wuhan, China. JAMA Cardiol 2020;5:802–10. https://doi.org/10.1001/jamacardio.2020.0950
20. Guo T, Fan Y, Chen M et al. Cardiovascular implications of fatal outcomes of patients with coronavirus disease 2019 (COVID-19). JAMA Cardiol 2020;5:811–18. https://doi.org/10.1001/jamacardio.2020.1017
21. Alexander B, Baranchuk A. COVID-19 and myocardial injury. CMAJ 2020;192:E812–E813. https://doi.org/10.1503/cmaj.201230
22. Dhesi S, Shanks M, Tymchak WJ. Troponin rise in hospitalized patients with nonacute coronary syndrome: retrospective assessment of outcomes and predictors. Can J Cardiol 2015;31:296–301. https://doi.org/10.1016/j.cjca.2014.11.032
23. Siddiqi HK, Mehra MR. COVID-19 illness in native and immunosuppressed states: a clinical-therapeutic staging proposal. J Heart Lung Transplant 2020;39:405–07. https://doi.org/10.1016/j.healun.2020.03.012
24. Lin Z, Long F, Yang Y, Chen X, Xu L, Yang M. Serum ferritin as an independent risk factor for severity in COVID-19 patients. J Infect 2020;81:647–79. https://doi.org/10.1016/j.jinf.2020.06.053
25. Verity R, Okell LC, Dorigatti I et al. Estimates of the severity of coronavirus disease 2019: a model-based analysis. Lancet Infect Dis 2020;20:669–77. https://doi.org/10.1016/S1473-3099(20)30243-7
26. Tan SY, Sungar GW, Myers J, Sandri M, Froelicher V. A simplified clinical electrocardiogram score for the prediction of cardiovascular mortality. Clin Cardiol 2009;32:82–6. https://doi.org/10.1002/clc.20288
