In this new regular series ‘ECGs for the fainthearted’ Dr Heather Wetherell will be interpreting ECGs in a non-threatening and simple way. She hopes this will help keep the art alive in primary care. In this first article, she looks at ECG methodical analysis
Normal values
Firstly, the most important things to know, are normal values.
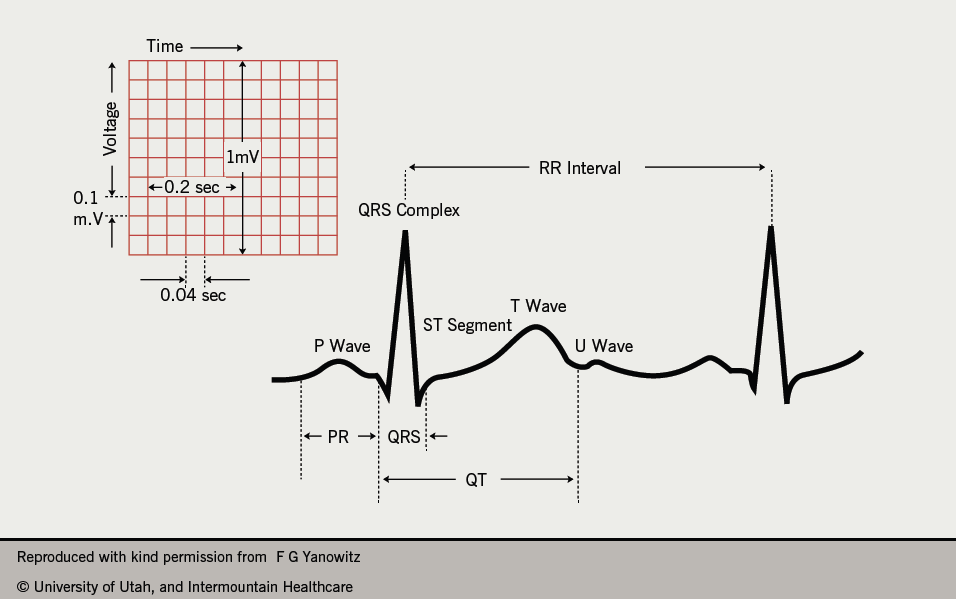
Providing the paper speed is standard at 25 mm/second, then each small square = 0.04 seconds. So the only other thing you need to know, in order to correctly identify ECG abnormalities, is your 4 times table! Simple.
Looking at figure 1, you can see the following:
- 1 small square on an ECG trace (at 25 mm/s speed) = 0.04 s
- The P wave 0.08–0.11 seconds (2–3 small squares)
- PR interval 0.11–0.20 seconds (3–5 small squares)
- QRS complex 0.06–0.11 seconds (1.5–2.5 small squares)
- QT interval 0.36–0.44 (9–11 small squares).

The basics of ECG analysis
Call me sad, but when I see an ECG, I like to play that ‘Keep talking’ quiz game when you talk for three minutes without hesitation, interruption or repetition.
It’s a great exam technique for students – don’t let the examiner get a word in edgeways. Fill the time with FACTS, and don’t make guesses (for three minutes, at least) and you can’t go wrong!
For every ECG, all you need to do is describe what you see and you’re half way there.
Always consider the following aspects, learn them by rote, and talk away.
First ask yourself three questions, and then just talk away:
- Is there electrical activity seen?
- Is this a 12 lead, or single lead, analysis?
- Is the paper speed (25 mm/s) and gain (1mv=1cm) standard?
Then comment on:
Rhythm
- Atrial rhythm – regular or irregular?
- Ventricular rhythm – regular or irregular?
- Overall regularity – regular or irregular?
Rate
- Atrial rate (P waves)
- Ventricular rate (QRS complexes)
P-wave
- Presence
- Appearance (morphology)
- Size (<3 mm tall)
- Duration
- Consistency (in appearance)
- Relationship to QRS
P-R interval
- Duration
- Consistency (does it alter between complexes?)
QRS complex
- Presence
- Appearance – morphology (narrow, duration <3 small squares)
- Consistency – same in all leads?
- QT interval
T-wave
- Presence
- Morphology (rounded? tented? axis/orientation? – should point in the same direction as the associated R wave, but be of smaller amplitude)
ST segment
- Isoelectric (normal) or Depression? / Elevation?
Axis (if 12 lead)
All of this is just factual stuff. You can talk away for three minutes without even attempting to analyse, let alone have a stab at a diagnosis!
If you methodically consider the above whenever faced with an ECG, you’ll always end up with some sort of sensible diagnosis. Even if you guess wrong, the intelligent banter that you’ve just displayed will as least make people think it was a very educated guess!
The main things to remember, and to know by heart, are:
- The lead appearances, and orientation, of a normal 12-lead ECG.
- The normal values for size, and duration, of the waves forms.
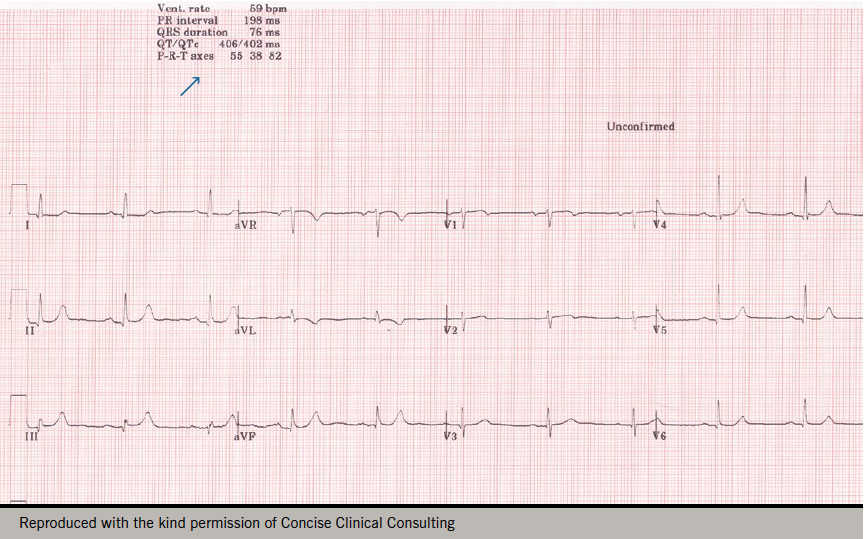
So, for starters, here’s a NORMAL 12-lead ECG (figure 2)

Always bear in mind the direction of a normal electrical impulse through the myocardium, and the position of the electrodes on the external chest wall/limbs. That way, you should be able to remember, which lead complexes/waveforms should always be positive. For this reason the QRS wave aVR should always be negative.
Remember – ECG interpretation is an ‘art form’. Factual descriptions, based on the above, can never be truly ‘wrong’.
That’s reassuring for us dummies :-).
