Advancements in computer and transducer technologies over the past two decades have allowed the development of three-dimensional (3D) echocardiography (3DE), which offers significant additional clinical information to traditional two-dimensional (2D) echocardiography (2DE). However, the majority of departmental studies today remain 2D, and adoption of 3DE as a complementary tool into mainstream clinical practice has not been without its difficulties. Although cardiologists have a range of alternative imaging modalities at their disposal to investigate cardiovascular structure and function, given the pace of technological innovation and improvements in data analysis, the field of 3DE is one of great expectation and is likely to be of increasing clinical importance. In this review, we discuss the role of 3DE, its advantages and limitations, and how novel technology will help workflow and expand its routine use.
Chamber dimensions and function: superior endocardial visualisation and freedom from geometric modelling
Left ventricular volume and function
The majority of echocardiographic studies are performed to investigate left ventricular (LV) chamber dimensions and LV ejection fraction (LVEF).1 Current methods via two-dimensional (2D) echocardiography (2DE) are operator-dependent, relying on the visual interpretation of moving images, and succumb to inter- and intra-observer variability and poor test–retest reliability.2-4 To calculate a volume, geometric modelling of chamber shape must be performed and consequently, LVEF estimation from 2DE is subject to bias and error in the presence of pathology. Endocardial visualisation, necessary to define chamber dimensions, is often difficult in 2DE, and to counter this the transducer may be tilted to obtain better images. This produces inherent problems, notably oblique or ‘foreshortened’ views, resulting in less accurate and consistent geometric modelling, specifically due to incorrect location of the apex.5
Three-dimensional (3D) echocardiography (3DE) offers several important advantages. It measures a third dimension, is not reliant on plane positioning and does not require geometric modelling or assumptions about chamber shape. The introduction of fully sampled matrix-array transducers (containing 3,000 piezoelectric elements) allows the measurement of pyramidal volume datasets from a single apical window. Through direct volume measurements, it is more accurate and reliable. Since the mid-1990s, studies have validated the ability of real-time 3DE to accurately and reproducibly quantify LV volumes, demonstrating good correlation to alternative imaging modalities, e.g. quantitative single-photon emission computer tomography (qSPECT) and cardiac magnetic resonance imaging (CMR).5-9 Initial in vitro and in vivo studies using canine ventricles of known volume and varying shape showed improved accuracy in measuring LV volume and function via 3DE compared with 2DE, particularly with asymmetric shapes, such as LV aneurysms.6,8
Meta-analyses have also supported these findings – Dorosz et al. pooled 23 studies (1,638 echocardiograms) and found that compared with 2DE, 3DE was more accurate for LV end-systolic volume (ESV), LV end-diastolic volume (EDV) and LVEF, although it did identify the underestimation of volumes compared with CMR as a systematic bias (now understood to relate to exclusion of trabeculae from ventricular volumes on CMR).10,11 Furthermore, the ability of real-time 3DE to produce volume–time curves, a reflection of continuous LV volume changes throughout the cardiac cycle allowing more detailed quantitative analysis of LV performance (e.g. LV filling rates), has been demonstrated and correlate well with CMR.12 CMR is not without its limitations, notably cost, increasing time, and patient claustrophobia. Finally, European Association of Echocardiography/American Society of Echocardiography guidelines state that transthoracic and transoesophageal 3DE to assess LV volumes and LVEF is “recommended over the use of 2DE, as it has been clearly demonstrated to provide more accurate and reproducible measurements”.13 The British Society of Echocardiography also recommends, in its protocol for a minimum dataset for a standard adult transthoracic echocardiogram (TTE), that 3D volumes should be considered for LV EDV and ESV.14
Right ventricular volume and function
Similarly, investigation of right ventricular (RV) volumes by 2DE requires geometric modelling, which is particularly challenging due to the crescentic shape of the right ventricle. 3DE is superior to 2DE for this purpose, but may underestimate volumes compared with CMR, a finding supported by a meta-analysis of 23 studies.15,16 Shimada et al. found that larger RV ESV and EDV were associated with greater underestimation (p<0.00001), while older age (p<0.04) was significantly associated with an overestimation. Larger ejection fraction (EF) (p<0.00001) and older age (p<0.0001) were significantly associated with an underestimation of RV EF.16 By identifying systematic bias, improvements can be tailored to improve accuracy.
Planning and peri-operative guidance of cardiac interventions
Surgical ‘en-face’ views and better anatomical definition
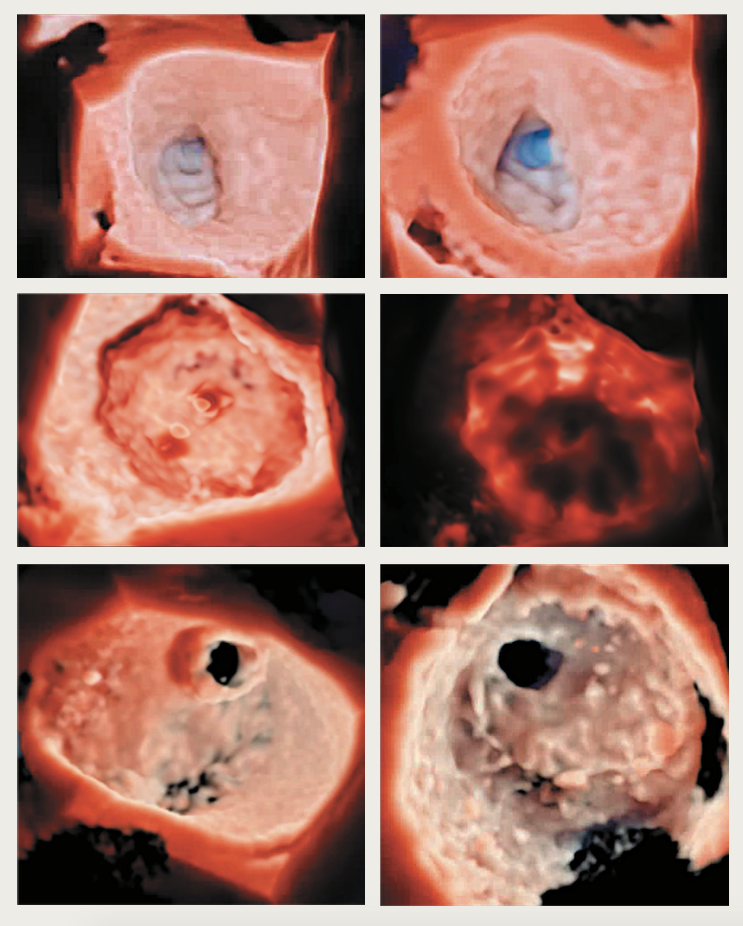
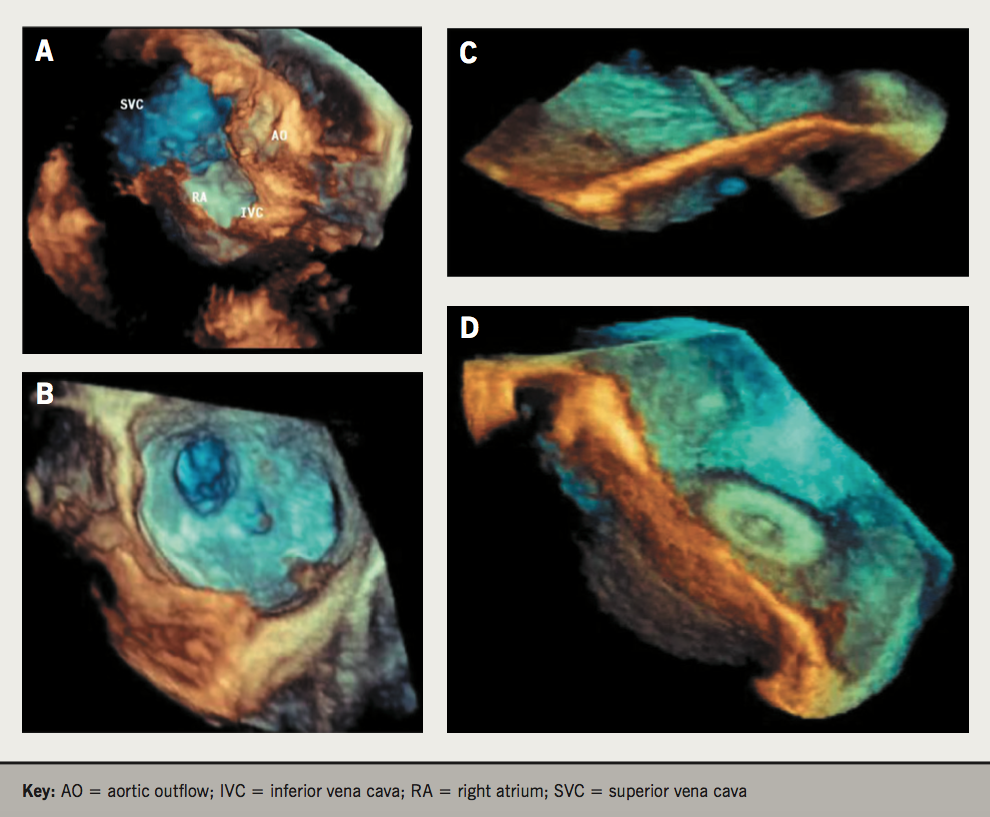
A major advantage that 3DE offers is improved visualisation of cardiac structures and pathology (figure 1). ‘Surgical’ perpendicular (en-face) views of valves can be obtained that aid interventions and assessment of procedural success. The benefit of high anatomical definition, likened to examining a heart specimen, is advantageous in various cardiac conditions, but particularly apparent in the management of complex structural heart disease, such as congenital and valvular defects (figure 2).17 A small study (n=43) in a single paediatric cardiology centre found that reconstructed 3DE was particularly useful in evaluating four subgroups of complex congenital heart disease:18
- Extracardiac structures, e.g. aberrant subclavian arteries/tortuous ductus arteriosus
- Ventricular septal defects in complex anomalies, e.g. positioning relative to double-outlet right ventricle
- Very complex defects with unusual spatial relationships, e.g. criss-cross heart
- Atrioventricular valve anomalies in complex cardiac defects, e.g. Ebstein’s anomaly.
The development of high-definition photorealistic rendering with the ability to view structures from opposing directions and change the light source on reconstruction (e.g. surgical view of mitral valve from unroofed left atrium [LA] towards atrioventricular junction; view from LV apex towards atrioventricular junction displays the valve from below) provides additional anatomical detail (figure 1). Evidence suggests procedure times may also be reduced – a single-centre study (n=70) investigating 3DE-assisted mitral balloon valvuloplasty showed significantly reduced transseptal-to-balloon and fluoroscopy times.19
Aortic stenosis and transcatheter aortic valve implantation (TAVI)
The severity of aortic stenosis (AS) depends on several parameters including the peak jet velocity (Vmax), mean transvalvular pressure gradient and aortic valve area (AVA).20 However, the criteria for grading severe AS (Vmax >4 m/s; pressure gradient >40 mmHg; AVA <1 cm2) are discordant in 20–30% of patients with normal systolic LV function. Minners et al. (n=3,483 echocardiographic studies) calculated curve fits for the relationship between AVA and 1) pressure gradient and 2) Vmax using the Gorlin and continuity equations, respectively. Based on AVA, they observed a greater proportion of patients classified as severe when compared with mean pressure gradient and Vmax. Stroke volume (SV) was also lower in inconsistently graded patients.21 Discrepancies also result from suboptimal imaging plane positioning (e.g. overestimation of AVA due to cut-plane angulation or parallel shift), errors that Kasprzak et al. showed can be reduced with 3DE, which allows accurate quantification with improved reproducibility.22 3DE is also able to resolve discrepancies, particularly in cases of paradoxical low-flow, low-gradient severe AS with preserved EF. These patients may be relatively frequent (up to 35% of cases) and often have reduced SV.23 The most common error in the 2DE diagnosis of low-flow, low-gradient AS is the underestimation of the LV outflow tract (LVOT) diameter measurement and the calculation of SV assuming the LVOT cross-section is circular.24 Since the LVOT is a dynamic, often elliptical 3D structure, 3DE is superior in measuring LVOT area and has been proposed as a hybrid technique (together with Doppler echocardiography to measure flow velocities) to overcome underestimation with 2DE.25,26
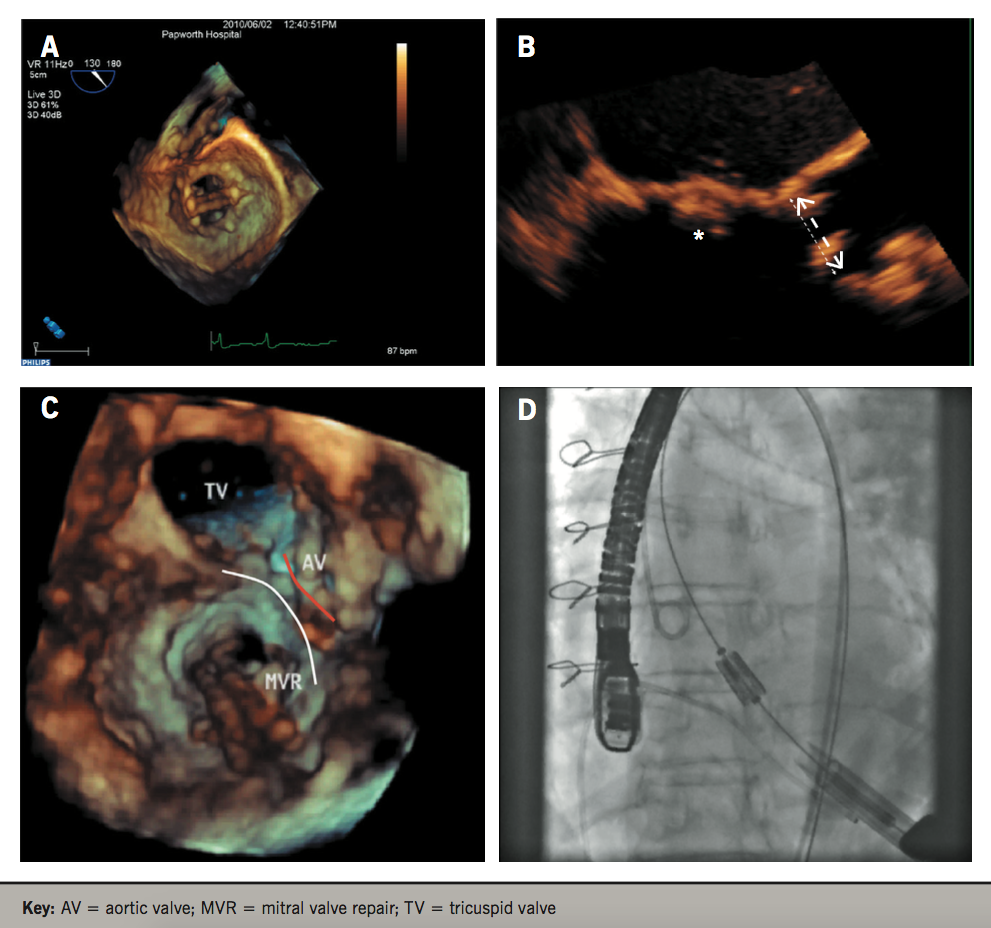
High-quality 3D images and portability of real-time 3DE machines (without the need for off-line computation) has made 3DE an attractive imaging modality to plan cardiac interventions and assess procedures intra-operatively. The use of catheter-based interventions to replace and repair valvular abnormalities has increased significantly over the past several decades and real-time 3D transoesophageal echocardiography (TOE) can assess prosthesis functioning and positioning immediately after valve implantation (figure 3). Bauer et al. demonstrated the reduction in transaortic pressure and increase in AVA after TAVI, and characterised the leaks associated, showing the majority (77%) were paraprosthetic.27 Quantification of aortic regurgitation after TAVI has also been shown to be superior and more accurate with 3DE compared with 2DE.28
Prior to implantation, the prosthetic valve must be sized and, historically, investigations were performed with 2D TTE and later TOE.29,30 The aortic valve, however, is elliptical, representing the transition between the LVOT and the ascending aorta, and standard views of the LVOT via 2D imaging often underestimate the maximum dimensions of the aortic annulus.30-32 Significant discrepancies between 2D and 3D imaging have been demonstrated and 3DE is associated with improved clinical outcomes.33 Husser et al. showed that although sizing of the aortic annulus with 3D TOE correlated with 2DE, mean diameters were significantly larger on 3DE (p<0.001) with a mean difference of 1.2 mm. Prosthesis sizing was more accurate via 3DE, predicting final prosthesis size in 80% of cases compared with 67% in 2DE. Importantly, in 26% of all cases, 3DE suggested a different prosthesis size compared with 2DE.34 An appropriately sized prosthesis is critical for anchoring, and reduces the risk of paravalvular leak, valve dysfunction, annular rupture, coronary occlusion or even valve migration.35,36 Furthermore, defining the annular-ostial distance (from the aortic annulus to coronary ostia) is crucial to avoid their occlusion. While 2D TOE can evaluate the distance for the right coronary artery, 3D TOE is critical as the left coronary lies within the coronary plane, which cannot be seen on standard 2DE.29
Multi-slice computed tomography (MSCT) has low intra- and inter-observer variability and is the current gold-standard in assessing the aortic annulus, providing additional information on important anatomical structures, such as the distance from the valve plane to the coronary arteries, aortic root dimensions and the degree of aortic valve calcification, which affects the risk of paravalvular regurgitation after TAVI.37-39 It is limited, however, by the presence of arrhythmias, artefacts and the use of radiation and contrast, an important consideration given that chronic kidney disease frequently accompanies severe AS and is an independent predictor of mortality after TAVI.40-42 3D TOE is a feasible alternative but has been suggested to derive smaller measurements compared with MSCT, with only a 44% agreement in perimeter annular sizing between 3DE and MSCT.43,44 Furthermore, using 3DE, up to 50% of patients would have received an inappropriate valve size. Further research is needed to optimise 3DE. Recent progress suggests that (semi-) automated software-assisted methods to measure the aortic annulus on 3DE are superior to traditional direct planimetry, correlate with MSCT in quantifying the aortic root, and that measurements of circumference-derived (rather than area-derived) annulus diameter may be better for valve sizing, as it results in a significantly lower incidence of paravalvular leak (p=0.015).45-47 Given the excellent outcomes demonstrated in recent randomised-controlled trials and registries, together with the expansion of the indication for TAVI to intermediate-risk patients as an alternative to surgical aortic valve replacement in recent American Heart Association guidelines, the demand for TAVI and 3DE is only set to grow.48-50
Mitral valve repair
3DE offers significant advantages when assessing the mitral valve (MV) and planning MV repair. In addition to providing surgical ‘en-face’ views, comparison with surgical inspection intra-operatively has shown the superiority of 3DE over 2DE.51 Since it is free from geometric assumptions (whereas 2DE depends on correct alignment of imaging planes), it is also able to measure the non-planar mitral annular geometry and diagnose pathology more accurately, which are critical for surgical planning.52-54 These include identifying prolapsing segments/scallops and associated chordae rupture, perforations, clefts and flail segments.55-57
The use of 3DE to assist in percutaneous mitral valve repair (PMVR) using the MitraClip device has also been shown to overcome significant limitations with 2DE, which is only able to provide a limited assessment of anatomy and morphological changes during and after PMVR. A post-procedural double-orifice MV is created after PMVR, and 2DE has not been validated to quantify the associated functional changes.58,59 Apart from aiding intra-operative guidance and positioning, 3DE is able to accurately visualise the MV and assess morphological and functional changes – Altiok et al. demonstrated that 3DE could, not only assess the reduction in mitral regurgitation volume after PMVR, but that PMVR effectiveness and post-procedural gradient across the MV are related to pre-procedural MV morphology characterised by 3DE.59,60
Other studies quantifying the improvement in mitral regurgitation after PMVR have shown 3DE (with colour flow Doppler) to be more reliable than 2DE and able to characterise the improvements in LV and RV strain (with speckle-tracking), as well as RV EF.61,62 3DE has also improved our understanding of acute changes in MV morphology after PMVR, namely an increase in annular ellipticity and coaptation area.63 Full-volume colour Doppler transthoracic 3DE (3D-FVCD) has also recently been shown to quantify mitral regurgitation more accurately than 2D proximal isovelocity surface area (PISA) or volumetric methods. Measurements correlated better with CMR and were less prone to underestimation, especially in multi-jet mitral regurgitation and dilated LV, compared with 2D methods.64 This is important since the presence of multi-jet mitral regurgitation was associated with a higher discrepancy between 2D-PISA and 3D-FVCD in identifying surgical candidates.
Automated analysis
LV volumes and function
Although 3DE offers significant improvements, several limitations to its incorporation into routine clinical investigation have hampered its wide acceptance. These include:
- additional costs
- non-availability of specialist 3DE expertise
- cumbersome acquisition methods
- complicated analysis software
- requirements to manually trace endocardial borders.
Consequently, these contribute to additional time required to complete an exam.65,66 Automatic chamber quantification techniques hold much promise and are a possible solution to speed this process and improve workflow. To this end, semi-automated analysis algorithms, able to achieve accurate endocardial contouring, have been developed and have been shown to be reliable and comparable with CMR. Corsi et al. demonstrated that a semi-automated volume analysis (segmentation) technique could reconstruct LV shape and evaluate volume.67 However, this method still relied on border detection in multiple planes and geometric modelling. To overcome this, a technique for direct, model-independent quantitative assessment of LV volumes and function was developed. By applying a semi-automated detection system to pyramidal volume datasets from fully sampled matrix-array transducers, fast and accurate assessments of LV function can be obtained.68 High correlation of LV volumes with CMR (r=0.98) and the ability to detect regional wall motion abnormalities and differences in LV function in patients with and without dilated cardiomyopathy have also been shown.3,69 Fully automated endocardial contouring systems have emerged showing excellent results. An automated trabecular endocardial contouring system of the LV cavity, able to automatically generate time volume curves, was shown in a study (n=91) to obtain measurements of LV volumes and function that correlated with CMR, were highly reproducible but significantly underestimated EDV and ESV.70
More recently, robust evidence has shown a fully automated software (HeartModel™, Philips Healthcare), the first commercially available software of its kind, is able to produce excellent results for both LA and LV volume quantification with minimal 3D software analysis training. Tsang et al. found a strong correlation between automated and manual 3DE measurements (r=0.87 to 0.96), and automated and CMR analysis (r=0.84 to 0.95) with low test–retest variability.71 Importantly, the automated system (with or without adjustments) significantly reduced the average analysis time per patient (manual: 144 ± 32 s; automated without adjustments: 26 ± 2 s; automated with adjustments: 76 ± 6 s) compared with manual assessment (p<0.0001). Validation studies and the impact of image quality in non-selected patients have also been subsequently studied with data suggesting that automated analysis was only possible in 66% of consecutive patients, as in the remainder, poor image quality hampered its reliability.72,73 A recent study by Lang and colleagues investigated the HeartModel™ system further.66 This automated software package uses a model-based adaptive analytics algorithm with a ‘one-button’ feature that can be activated to automatically calculate LV volumes, SV and LVEF without operator intervention. The model-based algorithm (MBA) automatically detects LV wall inner border at the blood-tissue interface and the outer border at the compacted myocardium interface. User-based modifications can also be made through a user-adjustable slider (positioned between the two borders) to optimise border identification. High feasibility was demonstrated (automatic volumes were possible in 94.5% of patients) and MBA-derived volumes significantly correlated with 2D-biplane estimations, 3D full-volume modality and CMR.66 User-adjusted slider optimisation further improved correlation. The HeartModel™ system can also simultaneously measure LA volumes from the same 3DE data set without reliance on geometrical assumptions. This is an important advantage over 2DE (which requires LA-focused views to minimise foreshortening and underestimation) given that LV end diastolic pressure (EDP) is a significant prognostic marker in many cardiovascular diseases.72,74-76
Aortic root and annulus
Similar progress has been made in automated analysis of the aortic root and annulus in candidates for TAVI, although the literature is much less compared with automated analysis for LV volumes and function. Automated quantitative 3D modelling of the aortic root from 3DE and computed tomography (CT) data is feasible, and recent studies have shown that quantitative analysis of the aortic annulus correlates excellently with manual methods, has high reproducibility, and may represent an alternative to MSCT.46,77 Prototype semi-automated software (Philips) that utilises multi-planar reconstruction but requires operator-dependent localisation of certain anatomical landmarks and border adjustment correlates well with CT (r=0.89 to 0.91), has <10% measurement variability and is superior to existing echocardiographic techniques (mitral valve software – designed for analysis of the mitral valve – and 3D planimetry).78 A recent retrospective study (n=150) on the automated Aortic Valve Navigator™ software (unreleased prototype; Philips) demonstrated high feasibility in accurately modelling and reproducibly quantifying aortic annular and root dimension with correlation between 3D TOE and MDCT, low inter- and intra-observer variability, and good correlation with conventional prosthesis sizing charts.79
Conclusion
3DE offers significant advantages in addition to 2DE and should be considered a complementary technique in routine practice. Besides minimising the need for geometric modelling and providing objective measurements of chamber size and function, 3DE offers a unique view of cardiac pathology and is a useful peri-operative tool, guiding placement and positioning of cardiac interventions. Its adoption into routine clinical practice has been limited and novel solutions that reduce time per examination and improve overall workflow will only help to enhance its adoption into mainstream cardiology. Indeed, 3DE should not be limited to tertiary centres given that the majority of the echocardiographic workload in district hospitals involves assessment of LV volume and function. Furthermore, although a wealth of data already supports the clinical benefits of 3DE, more extensive data on cost-effectiveness is awaited. Increasing 3DE experience and expertise will only help to disseminate its benefits, and emerging technological improvements in both software and hardware make this an area of potential growth – one that will also, no doubt, improve the care of our patients.
Key messages
- Three-dimensional echocardiography (3DE) has the potential to enhance two-dimensional echocardiography (2DE) imaging practice, and in some instances offers benefits to both clinicians and patients over conventional 2DE imaging
- 3DE has a strong potential to improve workflow and to add clinical value, 3DE solutions (such as HeartModel™) will provide wider benefits with greater uptake
- With trans-catheter interventions being performed routinely across the globe, 3DE plays a major role in device sizing and peri-procedural monitoring
Sponsorship statement/conflict of interest
This article was commissioned by the British Journal of Cardiology (BJC) on behalf of Philips Electronics UK Ltd, who provided the funding for the article and the round table meeting on which it is based. BJC engaged the participants, who received honorarium for their presenting participation, and also Dr Kevin Cheng for the writing of this piece. Philips had no input into the content of the article written by Dr Cheng, but has reviewed the article for regulatory compliance before publication.
Acknowledgements
We thank Professor Mark J Monaghan and Dr Rick Steeds for their permission to reproduce the figures used in this article.
Editors’ note
To find out more about Philips 3D Echo please visit: https://www.philips.co.uk/echo/BJC
References
1. Cameli M, Mondillo S, Solari M et al. Echocardiographic assessment of left ventricular systolic function: from ejection fraction to torsion. Heart Fail Rev 2016;21:77–94. https://doi.org/10.1007/s10741-015-9521-8
2. Gopal AS, Shen Z, Sapin PM et al. Assessment of cardiac function by three-dimensional echocardiography compared with conventional noninvasive methods. Circulation 1995;92:842–53. https://doi.org/10.1161/01.CIR.92.4.842
3. Jacobs LD, Salgo IS, Goonewardena S et al. Rapid online quantification of left ventricular volume from real-time three-dimensional echocardiographic data. Eur Heart J 2006;27:460–8. https://doi.org/10.1093/eurheartj/ehi666
4. Hoffmann R, Barletta G, von Bardeleben S et al. Analysis of left ventricular volumes and function: a multicenter comparison of cardiac magnetic resonance imaging, cine ventriculography, and unenhanced and contrast-enhanced two-dimensional and three-dimensional echocardiography. J Am Soc Echocardiogr 2014;27:292–301. https://doi.org/10.1016/j.echo.2013.12.005
5. Jenkins C, Bricknell K, Hanekom L, Marwick TH. Reproducibility and accuracy of echocardiographic measurements of left ventricular parameters using real-time three-dimensional echocardiography. J Am Coll Cardiol 2004;44:878–86. https://doi.org/10.1016/j.jacc.2004.05.050
6. Siu SC, Levine RA, Rivera JM et al. Three-dimensional echocardiography improves noninvasive assessment of left ventricular volume and performance. Am Heart J 1995;130:812–22. https://doi.org/10.1016/0002-8703(95)90082-9
7. Buck T, Hunold P, Wentz KU, Tkalec W, Nesser HJ, Erbel R. Tomographic three-dimensional echocardiographic determination of chamber size and systolic function in patients with left ventricular aneurysm: comparison to magnetic resonance imaging, cineventriculography, and two-dimensional echocardiography. Circulation 1997;96:4286–97. https://doi.org/10.1161/01.CIR.96.12.4286
8. Qin JX, Jones M, Shiota T et al. Validation of real-time three-dimensional echocardiography for quantifying left ventricular volumes in the presence of a left ventricular aneurysm: in vitro and in vivo studies. J Am Coll Cardiol 2000;36:900–07. https://doi.org/10.1016/S0735-1097(00)00793-2
9. Arai K, Hozumi T, Matsumura Y et al. Accuracy of measurement of left ventricular volume and ejection fraction by new real-time three-dimensional echocardiography in patients with wall motion abnormalities secondary to myocardial infarction. Am J Cardiol 2004;94:552–8. https://doi.org/10.1016/j.amjcard.2004.05.015
10. Dorosz JL, Lezotte DC, Weitzenkamp DA, Allen LA, Salcedo EE. Performance of 3-dimensional echocardiography in measuring left ventricular volumes and ejection fraction: a systematic review and meta-analysis. J Am Coll Cardiol 2012;59:1799–808. https://doi.org/10.1016/j.jacc.2012.01.037
11. Shimada YJ, Shiota T. A meta-analysis and investigation for the source of bias of left ventricular volumes and function by three-dimensional echocardiography in comparison with magnetic resonance imaging. Am J Cardiol 2011;107:126–38. https://doi.org/10.1016/j.amjcard.2010.08.058
12. Zeidan Z, Erbel R, Barkhausen J, Hunold P, Bartel T, Buck T. Analysis of global systolic and diastolic left ventricular performance using volume-time curves by real-time three-dimensional echocardiography. J Am Soc Echocardiogr 2003;16:29–37. https://doi.org/10.1067/mje.2003.40
13. Lang RM, Badano LP, Tsang W et al. EAE/ASE recommendations for image acquisition and display using three-dimensional echocardiography. J Am Soc Echocardiogr 2012;25:3–46. https://doi.org/10.1016/j.echo.2011.11.010
14. Wharton G, Steeds R, Allen J et al. A minimum dataset for a standard adult transthoracic echocardiogram: a guideline protocol from the British Society of Echocardiography. Echo Res Pract 2015;2:G9–G24. https://doi.org/10.1530/ERP-14-0079
15. Gopal AS, Chukwu EO, Iwuchukwu CJ et al. Normal values of right ventricular size and function by real-time 3-dimensional echocardiography: comparison with cardiac magnetic resonance imaging. J Am Soc Echocardiogr 2007;20:445–55. https://doi.org/10.1016/j.echo.2006.10.027
16. Shimada YJ, Shiota M, Siegel RJ, Shiota T. Accuracy of right ventricular volumes and function determined by three-dimensional echocardiography in comparison with magnetic resonance imaging: a meta-analysis study. J Am Soc Echocardiogr 2010;23:943–53. https://doi.org/10.1016/j.echo.2010.06.029
17. Vogel M, Ho SY, Lincoln C, Yacoub MH, Anderson RH. Three-dimensional echocardiography can simulate intraoperative visualization of congenitally malformed hearts. Ann Thorac Surg 1995;60:1282–8. https://doi.org/10.1016/0003-4975(95)00615-R
18. Del Pasqua A, Sanders SP, de Zorzi A et al. Impact of three-dimensional echocardiography in complex congenital heart defect cases: the surgical view. Pediatr Cardiol 2009;30:293–300. https://doi.org/10.1007/s00246-008-9348-3
19. Eng MH, Salcedo EE, Kim M, Quaife RA, Carroll JD. Implementation of real-time three-dimensional transesophageal echocardiography for mitral balloon valvuloplasty. Catheter Cardiovasc Interv 2013;82:994–8. https://doi.org/10.1002/ccd.25052
20. Baumgartner H, Hung J, Bermejo J et al. Recommendations on the echocardiographic assessment of aortic valve stenosis: a focused update from the European Association of Cardiovascular Imaging and the American Society of Echocardiography. Eur Heart J Cardiovasc Imaging 2017;18:254–75. https://doi.org/10.1093/ehjci/jew335
21. Minners J, Allgeier M, Gohlke-Baerwolf C, Kienzle R-P, Neumann F-J, Jander N. Inconsistencies of echocardiographic criteria for the grading of aortic valve stenosis. Eur Heart J 2008;29:1043–8. https://doi.org/10.1093/eurheartj/ehm543
22. Kasprzak JD, Nosir YF, Dall’Agata A et al. Quantification of the aortic valve area in three-dimensional echocardiographic data sets: analysis of orifice overestimation resulting from suboptimal cut-plane selection. Am Heart J 1998;135(6 Pt 1):995–1003. https://doi.org/10.1016/S0002-8703(98)70064-X
23. Hachicha Z, Dumesnil JG, Bogaty P, Pibarot P. Paradoxical low-flow, low-gradient severe aortic stenosis despite preserved ejection fraction is associated with higher afterload and reduced survival. Circulation 2007;115:2856–64. https://doi.org/10.1161/CIRCULATIONAHA.106.668681
24. Dumesnil JG, Pibarot P, Carabello B. Paradoxical low flow and/or low gradient severe aortic stenosis despite preserved left ventricular ejection fraction: implications for diagnosis and treatment. Eur Heart J 2010;31:281–9. https://doi.org/10.1093/eurheartj/ehp361
25. Clavel M-A, Burwash IG, Pibarot P. Cardiac imaging for assessing low-gradient severe aortic stenosis. JACC Cardiovasc Imaging 2017;10:185–202. https://doi.org/10.1016/j.jcmg.2017.01.002
26. Caballero L, Saura D, Oliva-Sandoval MJ et al. Three-dimensional morphology of the left ventricular outflow tract: impact on grading aortic stenosis severity. J Am Soc Echocardiogr 2017;30:28–35. https://doi.org/10.1016/j.echo.2016.10.006
27. Bauer F, Lemercier M, Zajarias A, Tron C, Eltchaninoff H, Cribier A. Immediate and long-term echocardiographic findings after transcatheter aortic valve implantation for the treatment of aortic stenosis: the Cribier-Edwards/Edwards-Sapien valve experience. J Am Soc Echocardiogr 2010;23:370–6. https://doi.org/10.1016/j.echo.2010.01.020
28. Altiok E, Frick M, Meyer CG et al. Comparison of two- and three-dimensional transthoracic echocardiography to cardiac magnetic resonance imaging for assessment of paravalvular regurgitation after transcatheter aortic valve implantation. Am J Cardiol 2014;113:1859–66. https://doi.org/10.1016/j.amjcard.2014.02.038
29. Zamorano JL, Badano LP, Bruce C et al. EAE/ASE recommendations for the use of echocardiography in new transcatheter interventions for valvular heart disease. J Am Soc Echocardiogr 2011;24:937–65. https://doi.org/10.1016/j.echo.2011.07.003
30. Kenny C, Monaghan M. How to assess aortic annular size before transcatheter aortic valve implantation (TAVI): the role of echocardiography compared with other imaging modalities. Heart Br Card Soc 2015;101:727–36. https://doi.org/10.1136/heartjnl-2013-304689
31. Zamorano JL, Gonçalves A, Lang R. Imaging to select and guide transcatheter aortic valve implantation. Eur Heart J 2014;35:1578–87. https://doi.org/10.1093/eurheartj/eht569
32. Zamorano J, Pardo A. 3D-ECHO for TAVI: two arrows, just in case. Eur Heart J Cardiovasc Imaging 2016;17:9–10. https://doi.org/10.1093/ehjci/jev282
33. Binder RK, Webb JG, Willson AB et al. The impact of integration of a multidetector computed tomography annulus area sizing algorithm on outcomes of transcatheter aortic valve replacement: a prospective, multicenter, controlled trial. J Am Coll Cardiol 2013;62:431–8. https://doi.org/10.1016/j.jacc.2013.04.036
34. Husser O, Rauch S, Endemann DH et al. Impact of three-dimensional transesophageal echocardiography on prosthesis sizing for transcatheter aortic valve implantation. Catheter Cardiovasc Interv 2012;80:956–63. https://doi.org/10.1002/ccd.23459
35. Mylotte D, Dorfmeister M, Elhmidi Y et al. Erroneous measurement of the aortic annular diameter using 2-dimensional echocardiography resulting in inappropriate CoreValve size selection: a retrospective comparison with multislice computed tomography. JACC Cardiovasc Interv 2014;7:652–61. https://doi.org/10.1016/j.jcin.2014.02.010
36. Athappan G, Patvardhan E, Tuzcu EM et al. Incidence, predictors, and outcomes of aortic regurgitation after transcatheter aortic valve replacement: meta-analysis and systematic review of literature. J Am Coll Cardiol 2013;61:1585–95. https://doi.org/10.1016/j.jacc.2013.01.047
37. Condado JF, Corrigan FE, Lerakis S et al. Anatomical risk models for paravalvular leak and landing zone complications for balloon-expandable transcatheter aortic valve replacement. Catheter Cardiovasc Interv 2017;90:690–700. https://doi.org/10.1002/ccd.26987
38. D’Ancona G, Agma HU, Ince H et al. Transcatheter aortic valve implantation with the direct flow medical prosthesis: Impact of native aortic valve calcification degree on outcomes. Catheter Cardiovasc Interv 2017;89:135–42. https://doi.org/10.1002/ccd.26517
39. McCabe JM, Dean LS. Pass the rock: calcium, the achilles heel of transcatheter valve replacement. Catheter Cardiovasc Interv 2017;89:142–3. https://doi.org/10.1002/ccd.26890
40. Kahn MR, Robbins MJ, Kim MC, Fuster V. Management of cardiovascular disease in patients with kidney disease. Nat Rev Cardiol 2013;10:261–73. https://doi.org/10.1038/nrcardio.2013.15
41. Levi A, Codner P, Masalha A et al. Predictors of 1-year mortality after transcatheter aortic valve implantation in patients with and without advanced chronic kidney disease. Am J Cardiol 2017;120:2025–30. https://doi.org/10.1016/j.amjcard.2017.08.020
42. Conrotto F, Salizzoni S, Andreis A et al. Transcatheter aortic valve implantation in patients with advanced chronic kidney disease. Am J Cardiol 2017;119:1438–42. https://doi.org/10.1016/j.amjcard.2017.01.042
43. Tamborini G, Fusini L, Muratori M et al. Feasibility and accuracy of three-dimensional transthoracic echocardiography vs. multidetector computed tomography in the evaluation of aortic valve annulus in patient candidates to transcatheter aortic valve implantation. Eur Heart J Cardiovasc Imaging 2014;15:1316–23. https://doi.org/10.1093/ehjci/jeu157
44. Vaquerizo B, Spaziano M, Alali J et al. Three-dimensional echocardiography vs. computed tomography for transcatheter aortic valve replacement sizing. Eur Heart J Cardiovasc Imaging 2016;17:15–23. https://doi.org/10.1093/ehjci/jev238
45. Khalique OK, Hamid NB, White JM et al. Impact of methodologic differences in three-dimensional echocardiographic measurements of the aortic annulus compared with computed tomographic angiography before transcatheter aortic valve replacement. J Am Soc Echocardiogr 2017;30:414–21. https://doi.org/10.1016/j.echo.2016.10.012
46. García-Martín A, Lázaro-Rivera C, Fernández-Golfín C et al. Accuracy and reproducibility of novel echocardiographic three-dimensional automated software for the assessment of the aortic root in candidates for transcatheter aortic valve replacement. Eur Heart J Cardiovasc Imaging 2016;17:772–8. https://doi.org/10.1093/ehjci/jev204
47. Papachristidis A, Papitsas M, Roper D et al. Three-dimensional measurement of aortic annulus dimensions using area or circumference for transcatheter aortic valve replacement valve sizing: does it make a difference? J Am Soc Echocardiogr 2017;30:871–8. https://doi.org/10.1016/j.echo.2017.05.014
48. Thourani VH, Kodali S, Makkar RR et al. Transcatheter aortic valve replacement versus surgical valve replacement in intermediate-risk patients: a propensity score analysis. Lancet 2016;387:2218–25. https://doi.org/10.1016/S0140-6736(16)30073-3
49. Nishimura RA, Otto CM, Bonow RO et al. 2017 AHA/ACC focused update of the 2014 AHA/ACC guideline for the management of patients with valvular heart disease: a report of the American College of Cardiology/American Heart Association Task Force on Clinical Practice Guidelines. Circulation 2017;135:e1159–e1195. https://doi.org/10.1161/CIR.0000000000000503
50. Tarantini G, Nai Fovino L, Gersh BJ. Transcatheter aortic valve implantation in lower-risk patients: what is the perspective? Eur Heart J 2018;39:658–66. https://doi.org/10.1093/eurheartj/ehx489
51. Tsang W, Lang RM. Three-dimensional echocardiography is essential for intraoperative assessment of mitral regurgitation. Circulation 2013;128:643–52; discussion 652. https://doi.org/10.1161/CIRCULATIONAHA.112.120501
52. Foster GP, Dunn AK, Abraham S, Ahmadi N, Sarraf G. Accurate measurement of mitral annular dimensions by echocardiography: importance of correctly aligned imaging planes and anatomic landmarks. J Am Soc Echocardiogr 2009;22:458–63. https://doi.org/10.1016/j.echo.2009.02.008
53. Noack T, Kiefer P, Ionasec R et al. New concepts for mitral valve imaging. Ann Cardiothorac Surg 2013;2:787–95. https://doi.org/10.3978/j.issn.2225-319X.2013.11.01
54. Calleja A, Poulin F, Woo A et al. Quantitative modeling of the mitral valve by three-dimensional transesophageal echocardiography in patients undergoing mitral valve repair: correlation with intraoperative surgical technique. J Am Soc Echocardiogr 2015;28:1083–92. https://doi.org/10.1016/j.echo.2015.04.019
55. Manda J, Kesanolla SK, Hsuing MC et al. Comparison of real time two-dimensional with live/real time three-dimensional transesophageal echocardiography in the evaluation of mitral valve prolapse and chordae rupture. Echocardiogr Mt Kisco N 2008;25:1131–7. https://doi.org/10.1111/j.1540-8175.2008.00832.x
56. Shah PM, Raney AA. Echocardiography in mitral regurgitation with relevance to valve surgery. J Am Soc Echocardiogr 2011;24:1086–91. https://doi.org/10.1016/j.echo.2011.08.017
57. Sugimoto T, Dulgheru R, Marchetta S et al. What does 3D echocardiography add to 2D echocardiography in the assessment of mitral regurgitation? Curr Cardiol Rep 2017;19:90. https://doi.org/10.1007/s11886-017-0901-7
58. Zoghbi WA, Enriquez-Sarano M, Foster E et al. Recommendations for evaluation of the severity of native valvular regurgitation with two-dimensional and Doppler echocardiography. J Am Soc Echocardiogr 2003;16:777–802. https://doi.org/10.1016/S0894-7317(03)00335-3
59. Altiok E, Hamada S, Brehmer K et al. Analysis of procedural effects of percutaneous edge-to-edge mitral valve repair by 2D and 3D echocardiography. Circ Cardiovasc Imaging 2012;5:748–55. https://doi.org/10.1161/CIRCIMAGING.112.974691
60. Avenatti E, Barker CM, Little SH. Tricuspid regurgitation repair with a MitraClip device: the pivotal role of 3D transoesophageal echocardiography. Eur Heart J Cardiovasc Imaging 2017;18:380. https://doi.org/10.1093/ehjci/jew311
61. Gruner C, Herzog B, Bettex D et al. Quantification of mitral regurgitation by real time three-dimensional color Doppler flow echocardiography pre- and post-percutaneous mitral valve repair. Echocardiogr Mt Kisco N 2015;32:1140–6. https://doi.org/10.1111/echo.12809
62. Vitarelli A, Mangieri E, Capotosto L et al. Assessment of biventricular function by three-dimensional speckle-tracking echocardiography in secondary mitral regurgitation after repair with the MitraClip system. J Am Soc Echocardiogr 2015;28:1070–82. https://doi.org/10.1016/j.echo.2015.04.005
63. Al Amri I, Debonnaire P, van der Kley F et al. Acute effect of MitraClip implantation on mitral valve geometry in patients with functional mitral regurgitation: insights from three-dimensional transoesophageal echocardiography. EuroIntervention J Eur Collab Work Group Interv Cardiol Eur Soc Cardiol 2016;11:1554–61. https://doi.org/10.4244/EIJY15M09_09
64. Heo R, Son J-W, Ó Hartaigh B et al. Clinical implications of three-dimensional real-time color Doppler transthoracic echocardiography in quantifying mitral regurgitation: a comparison with conventional two-dimensional methods. J Am Soc Echocardiogr 2017;30:393–403.e7. https://doi.org/10.1016/j.echo.2016.12.010
65. Pepi M, Tamborini G, Pontone G et al. Initial experience with a new on-line transthoracic three-dimensional technique: assessment of feasibility and of diagnostic potential. Ital Heart J 2003;4:544–50.
66. Tamborini G, Piazzese C, Lang RM et al. Feasibility and accuracy of automated software for transthoracic three-dimensional left ventricular volume and function analysis: comparisons with two-dimensional echocardiography, three-dimensional transthoracic manual method, and cardiac magnetic resonance imaging. J Am Soc Echocardiogr 2017;30:1049–58. https://doi.org/10.1016/j.echo.2017.06.026
67. Corsi C, Saracino G, Sarti A, Lamberti C. Left ventricular volume estimation for real-time three-dimensional echocardiography. IEEE Trans Med Imaging 2002;21:1202–8. https://doi.org/10.1109/TMI.2002.804418
68. Caiani EG, Corsi C, Zamorano J et al. Improved semiautomated quantification of left ventricular volumes and ejection fraction using 3-dimensional echocardiography with a full matrix-array transducer: comparison with magnetic resonance imaging. J Am Soc Echocardiogr 2005;18:779–88. https://doi.org/10.1016/j.echo.2004.12.015
69. Corsi C, Lang RM, Veronesi F et al. Volumetric quantification of global and regional left ventricular function from real-time three-dimensional echocardiographic images. Circulation 2005;112:1161–70. https://doi.org/10.1161/CIRCULATIONAHA.104.513689
70. Thavendiranathan P, Liu S, Verhaert D et al. Feasibility, accuracy, and reproducibility of real-time full-volume 3D transthoracic echocardiography to measure LV volumes and systolic function: a fully automated endocardial contouring algorithm in sinus rhythm and atrial fibrillation. JACC Cardiovasc Imaging 2012;5:239–51. https://doi.org/10.1016/j.jcmg.2011.12.012
71. Tsang W, Salgo IS, Medvedofsky D et al. Transthoracic 3D echocardiographic left heart chamber quantification using an automated adaptive analytics algorithm. JACC Cardiovasc Imaging 2016;9:769–82. https://doi.org/10.1016/j.jcmg.2015.12.020
72. Medvedofsky D, Mor-Avi V, Byku I et al. Three-dimensional echocardiographic automated quantification of left heart chamber volumes using an adaptive analytics algorithm: feasibility and impact of image quality in nonselected patients. J Am Soc Echocardiogr 2017;30:879–85. https://doi.org/10.1016/j.echo.2017.05.018
73. Medvedofsky D, Mor-Avi V, Amzulescu M et al. Three-dimensional echocardiographic quantification of the left-heart chambers using an automated adaptive analytics algorithm: multicentre validation study. Eur Heart J Cardiovasc Imaging 2018;19:47–58. https://doi.org/10.1093/ehjci/jew328
74. Hoit BD. Left atrial size and function. J Am Coll Cardiol 2014;63:493–505. https://doi.org/10.1016/j.jacc.2013.10.055
75. Russo C, Jin Z, Homma S et al. LA phasic volumes and reservoir function in the elderly by real-time 3D echocardiography. JACC Cardiovasc Imaging 2017;10:976–85. https://doi.org/10.1016/j.jcmg.2016.07.015
76. Surkova E, Badano LP, Genovese D et al. Clinical and prognostic implications of methods and partition values used to assess left atrial volume by two-dimensional echocardiography. J Am Soc Echocardiogr 2017;30:1119–29. https://doi.org/10.1016/j.echo.2017.07.015
77. Calleja A, Thavendiranathan P, Ionasec RI et al. Automated quantitative 3-dimensional modeling of the aortic valve and root by 3-dimensional transesophageal echocardiography in normals, aortic regurgitation, and aortic stenosis: comparison to computed tomography in normals and clinical implications. Circ Cardiovasc Imaging 2013;6:99–108. https://doi.org/10.1161/CIRCIMAGING.112.976993
78. Mediratta A, Addetia K, Medvedofsky D et al. 3D echocardiographic analysis of aortic annulus for transcatheter aortic valve replacement using novel aortic valve quantification software: comparison with computed tomography. Echocardiogr Mt Kisco N 2017;34:690–9. https://doi.org/10.1111/echo.13483
79. Prihadi EA, van Rosendael PJ, Vollema EM, Bax JJ, Delgado V, Ajmone Marsan N. Feasibility, accuracy, and reproducibility of aortic annular and root sizing for transcatheter aortic valve replacement using novel automated three-dimensional echocardiographic software: comparison with multi-detector row computed tomography. J Am Soc Echocardiogr 2017;online first. https://doi.org/10.1016/j.echo.2017.10.003
