This is a case series of 10 patients who presented with the same electrocardiogram (ECG) manifestation of new-onset giant T-wave inversion and QT prolongation over a period of 24 months in a district general hospital. This unique ECG manifestation has been described with several cardiac and non-cardiac conditions.
Introduction
We published three cases with electrocardiogram (ECG) manifestation of new-onset giant T-wave inversion and QT prolongation associated with significant left main/left anterior descending artery disease in 2015.1 Since this publication we prospectively looked for patients in coronary care and the cardiology ward in our hospital who were admitted with, or developed during hospital stay, the above ECG changes. We found 10 patients with similar ECG features between March 2016 and February 2018. Four cases were associated with significant left main stem and/or left anterior descending coronary artery disease. Two cases were due to Takotsubo cardiomyopathy, one case due to pulmonary embolism and one was associated with pulmonary oedema in a background of severe left ventricular dysfunction. In two cases, no overt cause was found. This case series gives an idea of the frequency of this unique ECG manifestation in general and of its causes.
Cases
Table 1 shows details of the 10 cases found. Six of the cases are described below in more detail.
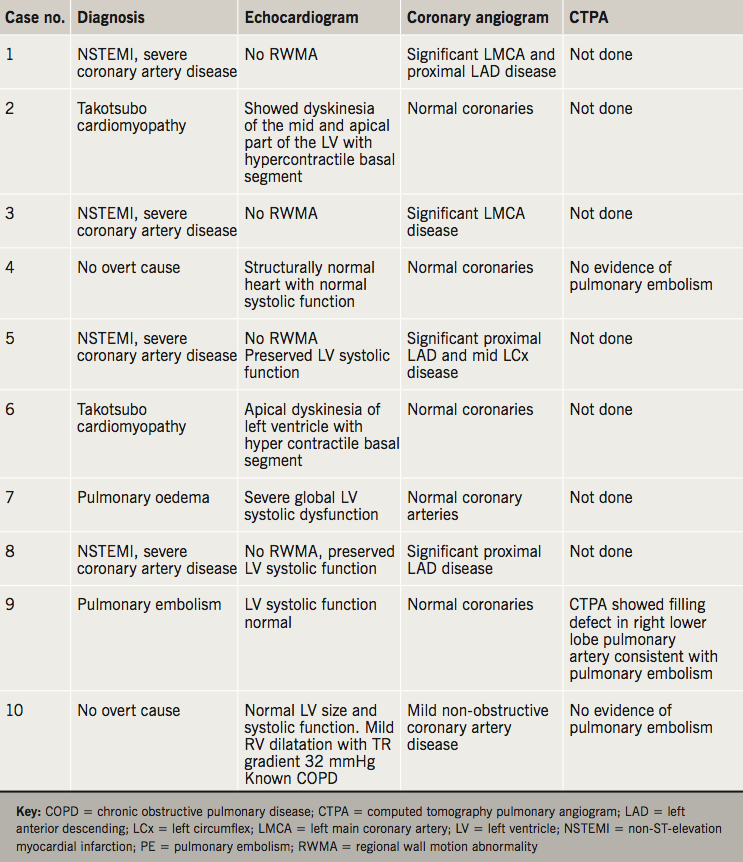
Case 1
An 84-year-old woman with no past of history of heart disease presented to the emergency department with acute onset chest pain. Her high-sensitivity (hs) troponin T was raised to 250 ng/L (normal 0–14 ng/L) and ECG showed giant T-wave inversion in the anterolateral leads with prolonged QT interval (corrected QT was 562 ms) (figure 1). Echocardiogram showed preserved left ventricular systolic function with no regional wall motion abnormality. Coronary angiogram showed severe left main stem disease with moderate disease in proximal left anterior descending artery.
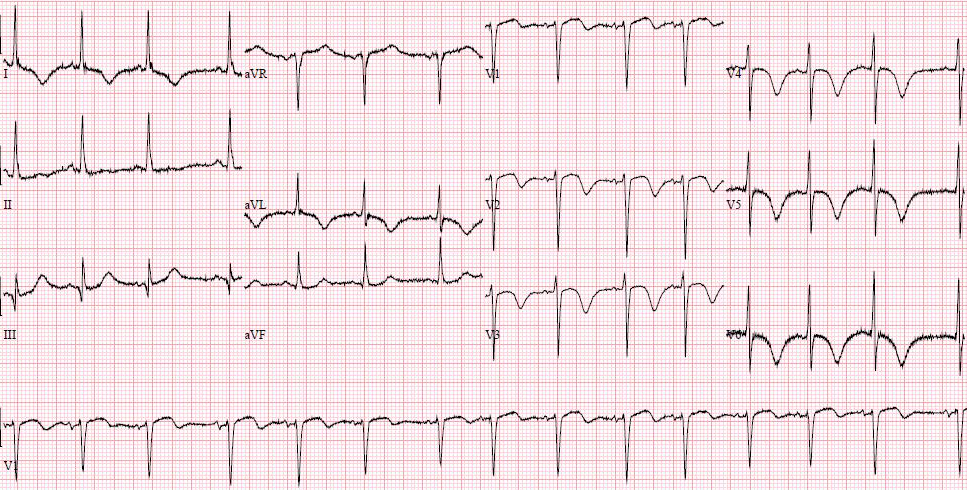
This symmetric precordial T-wave inversion as a manifestation of acute coronary syndrome was described in 1982 by de Zwaan et al. and this was correlated with critical stenosis of the proximal left anterior descending artery in coronary angiogram.2 In the case series of unstable angina and characteristic ECG changes associated with critical stenosis of left anterior descending artery published by de Zwaan et al. in 1989, 136 out of 180 patients had a similar pattern (described as type B pattern in the article).3 In this case, T-wave inversion was giant and there was extreme QT prolongation, which was not classically described in the above series. The giant T-wave inversion and extreme QT prolongation is an uncommon, but recognised, ECG manifestation of non-ST-elevation myocardial infarct (NSTEMI) correlating with significant left main/left anterior descending artery stenosis.1
Case 2
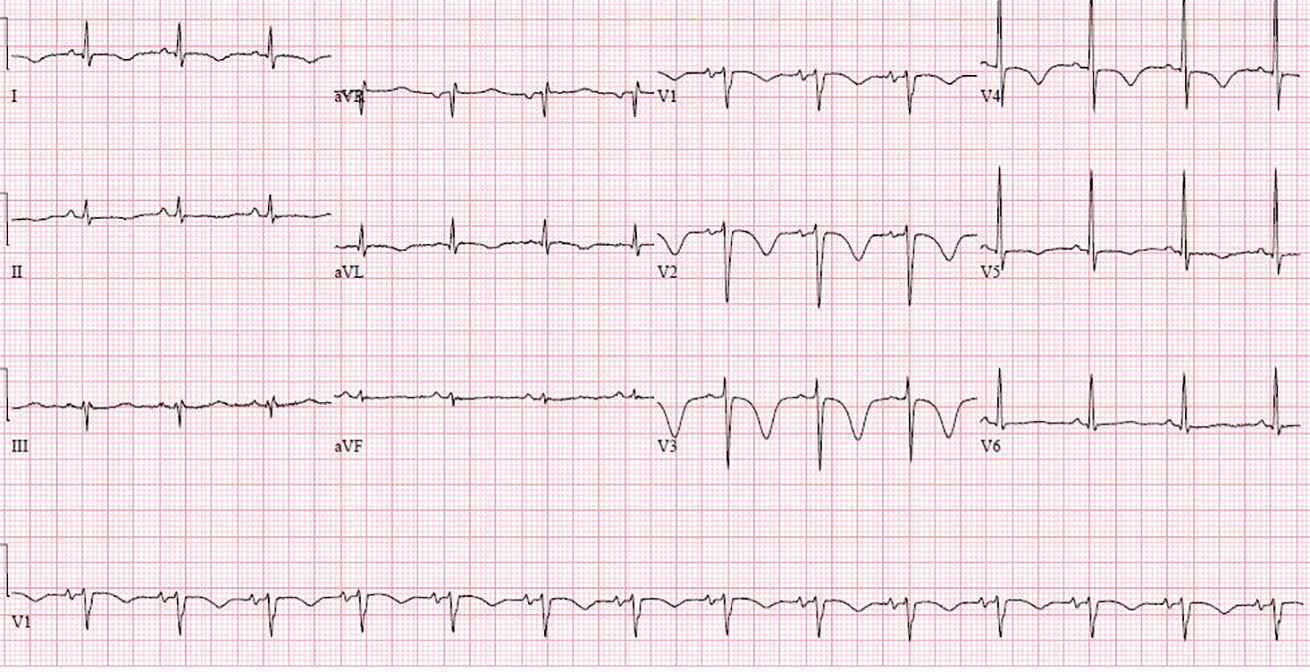
A 71-year-old woman presented to the emergency department with general weakness, dizziness and some episodes of chest pain for a few days. There was no history of diabetes or hypertension and she was a nonsmoker.
She was known to have ulcerative colitis and was on mesalazine. Her hs troponin T was 541 ng/L (normal <14 ng/L). ECG (figure 2) showed giant T-wave inversion with prolonged QT interval (corrected QT was 626 ms).

In view of chest pain, increased troponin and ECG changes she was treated for acute coronary syndrome (NSTEMI) and had a coronary angiogram performed, which showed normal coronary arteries. An echocardiogram showed dyskinesia of the mid and apical part of the left ventricle with hypercontractile basal segment. The echo feature was typical of Takotsubo cardiomyopathy. This was proved further by an echocardiogram after four weeks showing near normalisation of left ventricular systolic function. Takotsubo cardiomyopathy happens predominantly in post-menopausal women after severe mental or physical stress. There was no obvious trigger in our case. QT interval prolongation is also a well-noted ECG change associated with Takotsubo cardiomyopathy.4
Case 4
A 55-year-old woman with known chronic obstructive pulmonary disease and no history of heart ailments presented with sudden onset chest pain and some breathlessness. Her hs troponin was mildly elevated to 25 ng/L (normal 0–14 ng/L), ECG showed giant T-wave inversion in chest leads with prolonged QT interval (corrected QT interval 496 ms) (figure 3). Echocardiogram was normal and coronary angiogram showed normal coronaries. A computed tomography (CT) pulmonary angiogram showed no evidence of pulmonary embolism. There was no overt cause for her ECG changes. Cardiac magnetic resonance imaging (MRI) was not done.

Case 7
A 79-year-old man presented to the emergency department with shortness of breath for two days. His chest X-ray showed pulmonary oedema, his hs troponin T was raised to 456 ng/L (normal 0–14 ng/L). Echocardiogram showed severe global left ventricular systolic dysfunction, coronary angiogram showed mild non-obstructive coronary artery disease. ECG on admission did not show anything significant, but 24 hours after admission, an ECG (figure 4) showed giant T-wave inversion with prolonged QT interval (corrected QT was 594 ms). ECG gradually improved to baseline in a few days. The ECG changes were thought to be due to pulmonary oedema (cardiogenic but non-ischaemic). Giant T-wave inversion with extreme QT prolongation has also been described in the setting of non-ischaemic cardiogenic pulmonary oedema.5

Case 8
A 71-year-old woman presented with episodes of central chest pain at rest for 24 hours. There was no past cardiac history. ECG (figure 5) showed giant T-wave inversion and prolonged QT interval (corrected QT was 486 ms). Her hs troponin T was elevated to 438 ng/L (normal 0–14 ng/L). Echocardiogram showed mild hypokinesia in apex, mid anterior and anteroseptal wall. Coronary angiogram showed a very tight discrete lesion in the proximal left anterior descending artery, the rest of the coronary arteries were normal.

Case 9
A 79-year-old man with known chronic obstructive pulmonary disease presented with acute increase in shortness of breath and mild chest tightness. His hs troponin was raised to 231 ng/L (normal 0–14 ng/L) and D-dimer was 3,389 ng/ml (normal <230 ng/ml). CT pulmonary angiogram showed a filling defect in the right lower lobe pulmonary artery, consistent with pulmonary embolism. He was treated with a therapeutic dose of low molecular weight heparin. While in hospital, within 24 hours after admission, he had more chest pain and an ECG (figure 6) showed giant T-wave inversion with QT prolongation (corrected QT interval of 552 ms). He also had some non-sustained polymorphic ventricular tachycardia in the first 48 hours after admission.
In view of chest pain and ECG, a coronary angiogram was performed, which showed normal coronary arteries. T-wave inversion in anterior leads is a common ECG manifestation of pulmonary embolism, but giant T-wave inversion with prolonged QT is also a well-described ECG manifestation of pulmonary embolism.6,7
New-onset giant T-wave inversion has also been described in patients with intracranial bleed, pheochromocytoma, after electroconvulsive therapy, gastroenteritis,8 acute mesenteric ischaemia,9 and end-stage renal disease with hypocalcaemia.10
Discussion
Many single case reports and case series have been published mentioning a single cardiac or non-cardiac pathology associated with new-onset giant T-wave inversion in ECG. These have been mentioned above with each relevant case. There is only one case series of eight patients where the ECG feature of giant T-wave inversion was reported as a manifestation of various cardiac and non-cardiac pathologies.11 In this case series of eight patients, three cases did not have QTc prolongation. This series also included some cases of chronic giant T-wave inversion. In our series, we found QT interval was prolonged in all cases and we included only cases of giant T-wave inversion and prolonged QTc which were of new onset. In all cases the ECG changes reverted to normal in a few days’ to weeks’ time.
This case series shows the frequency of this unique ECG presentation in a district general hospital set up, and its causes. This hospital is not a heart attack centre and, hence, patients with acute ST-elevation myocardial infarcts are not admitted. This may have had an impact on the frequency of this ECG manifestation in general, and the distribution of its causes. It is very unlikely that we have missed any case with similar ECG features over the stipulated period because of admission to a non-cardiology ward, as we sincerely believe that all patients with such gross ECG changes will be referred to cardiology. A larger series involving both tertiary and district general set ups may provide the actual incidence of this ECG manifestation and of individual causes.
It is difficult to know the exact mechanism of this giant T-wave inversion and extreme QT prolongation. It is thought that a differential response of the epicardium and endocardium to various factors such as ischaemia, hypoxia and metabolic changes during acute events can cause dispersion in repolarisation, and this leads to a significant ventricular gradient producing giant T-wave changes and prolonged QT intervals.5
Key messages
- New-onset giant T-wave inversion with prolonged QT interval is an uncommon, but unique, electrocardiogram (ECG) manifestation
- It can be associated with several cardiac and non-cardiac conditions
- Non-ST-elevation myocardial infarction (NSTEMI) associated with significant left main/left anterior descending artery lesion is possibly the most common cause
Conflict of interest
None declared.
References
1. Chatterjee D. Extreme QT prolongation in elderly women after non-ST elevation myocardial infarct. Eur Heart Journal Acute Cardiovasc Care 2017;6:532–4 (published online first December 2015). https://doi.org/10.1177/2048872615624238
2. de Zwaan C, Bär FW, Wellens HJ. Characteristic electrocardiographic pattern indicating a critical stenosis high in left anterior descending coronary artery in patients admitted because of impending myocardial infarction. Am Heart J 1982;103:730–6. https://doi.org/10.1016/0002-8703(82)90480-X
3. de Zwaan C, Bär FW, Janssen JH et al. Angiographic and clinical characteristics of patients with unstable angina showing an ECG pattern indicating critical narrowing of the proximal LAD coronary artery. Am Heart J 1989;117:657–65. https://doi.org/10.1016/0002-8703(89)90742-4
4. Samuelov-Kinori L, Kinori M, Kogan Y et al. Takotsubo cardiomyopathy and QT interval prolongation: who are the patients at risk for torsades de pointes? J Electrocardiol 2009;42:353–7. https://doi.org/10.1016/j.jelectrocard.2009.01.005
5. Littmann L. Clinical studies: large T wave inversion and QT prolongation associated with pulmonary edema. A report of nine cases. J Am Coll Cardiol 1999;34:1106–10. https://doi.org/10.1016/S0735-1097(99)00311-3
6. QT interval prolongation with global T-wave inversion: a novel ECG finding in acute pulmonary embolism. Ann Noninvasive Electrocardiol 2004;9:94–8. https://doi.org/10.1111/j.1542-474X.2004.91528.x
7. Bonnemeier H, Mäuser W, Krauss T, Schunkert H. Significant QT-interval prolongation in pulmonary embolism – evidence for mechanoelectrical feedback. Heart 2009;95:147. https://doi.org/10.1136/hrt.2008.144113
8. Rott D, Leibowitz D, Weiss AT. Giant precordial T wave inversion in a patient with gastroenteritis. Case Rep Vasc Med 2011;2011:942045. https://doi.org/10.1155/2011/942045
9. Innabi A, Alzghoul B, Madmani M, Chatterjee K, Paydak H. Giant T wave inversions in acute mesenteric ischaemia: a novel presentation. Crit Care Med 2018;46(1 suppl 1):77. https://doi.org/10.1097/01.ccm.0000528208.13264.5a
10. Piestrzeniewicz K, Kurnatowska I, Ciurus T, Łuczak K, Drożdż J. Giant T wave inversion with QT prolongation in a patient with end stage renal disease and hypocalcemia. Folia Cardiologica 2016;11:327–9.
11. Said SA, Bloo R, De Nooijer R, Slootweg A. Cardiac and non-cardiac causes of T wave inversion in the precordial leads in adult subjects: a Dutch case series and review of the literature. World J Cardiol 2015;7:86–100. https://doi.org/10.4330/wjc.v7.i2.86
