Introduction
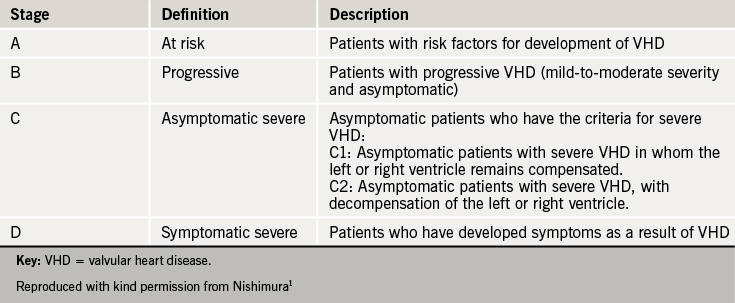
The clinical presentation of heart valve disease (HVD) varies widely, even for the same lesion of similar severity. The natural history of HVD is not well elucidated, although studies have been able to identify some high-risk features. Patients with HVD may present with mild or more advanced symptoms and signs, ranging from a subtle heart murmur to overt heart failure, or with incidental evidence of valvular abnormality on thoracic imaging by different modalities. Irrespective of the valve involved, presentation can occur at any stage of the disease, and the natural history is a progressive one. The recent American Heart Association (AHA)/American College of Cardiology (ACC) guidelines1) place greater emphasis on the progression of HVD, and suggest a four stage classification of HVD (see table 1) to better describe the whole spectrum and continuity of the disease.

This module describes what is known of the natural history of individual lesions, along with the symptoms and signs of each lesion.
Aortic stenosis
Natural history

Aortic stenosis (AS) is gradually progressive (see figure 1) and patients may remain asymptomatic for many years,2,3 even with severe stenosis. Typically symptoms develop above the age of 65 in those with calcific disease. However, bicuspid aortic valves are subject to abnormal shear stresses, resulting in earlier leaflet thickening and calcification. Intervention is required, typically between the ages of 50 and 70 years.4,5
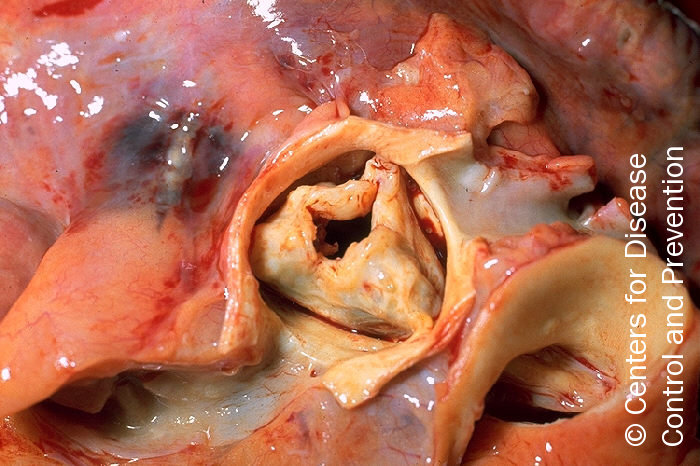
In industrially underdeveloped regions of the world, rheumatic AS (see figure 2) tends to result in symptoms between 20 and 50 years of age. However, calcified rheumatic valves are still found in the elderly in industrialised countries.
The annual rate of progression of aortic stenosis is, on average:
- A peak velocity increase by 0.3 m/s
- Mean pressure gradient increase by 8 mmHg6–10
- Effective orifice area fall by 0.1 cm2

Asymptomatic severe AS has low morbidity and mortality, with a risk of sudden death of approximately 1% per year. Survival rates in those declining surgery for severe symptomatic AS are between 15% and 50% at five years. More severe symptoms are associated with worse outcomes.2,11–16
However the mortality is 3-4% within three months of the onset of symptoms and thereafter 7% on a six month surgical waiting list. It is therefore vital to ensure that symptoms are reliably reported and an exercise test may be needed to check that a patient is genuinely asymptomatic. The duration of the asymptomatic phase varies widely between patients and the onset of symptoms is unpredictable. This is why regular follow-up of asymptomatic patients in a specialist valve clinic, combined with prompt surgical referral once symptoms develop, has been shown to result in outcomes similar to that of an age- and gender-matched population.17
