

Unfractionated heparin (UFH) is routinely used in percutaneous coronary intervention (PCI). The aim of this study was to determine whether the required dose of heparin used during PCI procedures has increased over time, which was our subjective observation.
This retrospective study analysed the required heparin dosage in 100 consecutive patients undergoing isolated PCI for each year between 2016 and 2024, starting from 1 January of each year. The primary analysis compared the total heparin dose administered (a) unadjusted and (b) adjusted for weight and procedure duration, between annual populations. A secondary analysis compared heparin dosage in patients with at least one activated clotting time (ACT) value >250 seconds, the target ACT level at our centre.
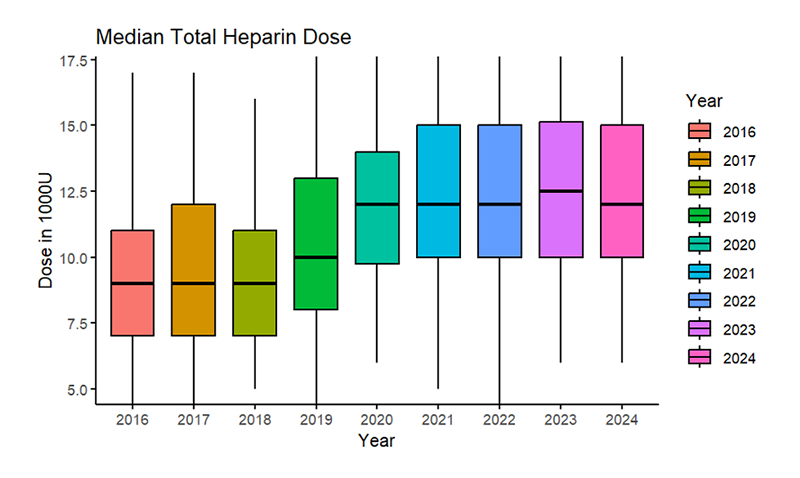
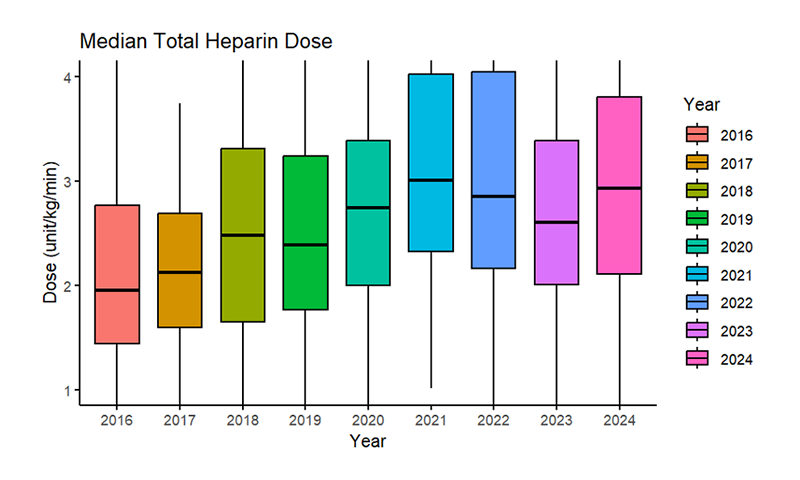
The median total heparin dose rose from 9,000 units (U) in 2016 (interquartile range [IQR] 7,000–11,000 U), to 12,000 U (IQR 10,000–15,000 U) in 2024 (p<0.001). The median weight- and time-adjusted total heparin dose in 2016 was 1.95 (IQR 1.44–2.77) U/kg/min compared with 2.93 (IQR 2.1–3.8) U/kg/min in 2024 (p<0.001).
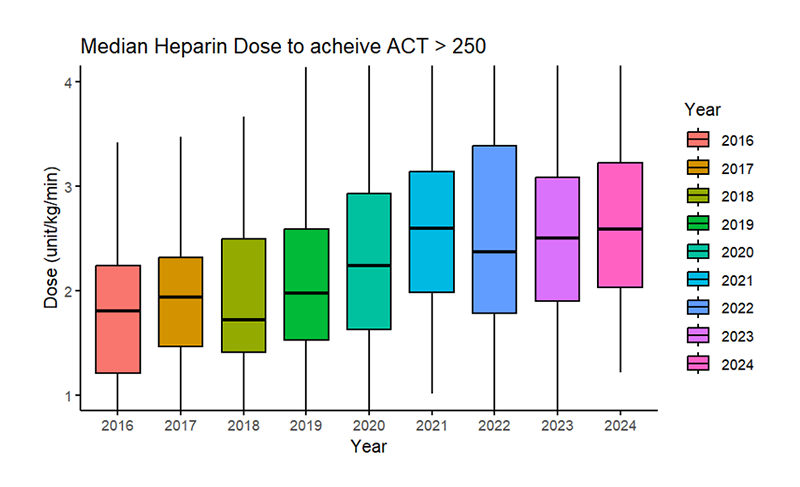
In the secondary analysis (in those who achieved a target ACT >250 seconds), the median dose was 1.81 (IQR 1.21–2.24) U/kg/min in 2016 versus 2.59 (IQR 2.03–3.22) U/kg/min in 2024 (p<0.001).
In conclusion, there has been a significant and unexplained increase in the total administered heparin dose for PCI cases in this centre between 2016 and 2024.
Introduction
Unfractionated heparin (UFH) is a naturally occurring anticoagulant released from mast cells.1 It works by reversibly binding to antithrombin III (AT III) and accelerating the rate at which AT III inactivates the coagulation enzymes thrombin (factor IIa) and factor Xa. Since its discovery in 1916,2 UFH has been the most widely used anticoagulant for procedural or therapeutic indications.3
Percutaneous coronary intervention (PCI) inevitably causes vessel wall injury, which leads to activation of platelets and a localised vascular inflammatory reaction, which is prothrombotic and associated with an increased risk of acute or subacute ischaemic events.4,5 The use of UFH in PCI has been well established to reduce such risks.6 However, the efficacy of UFH varies widely between individuals and is determined by a large number of factors, including pharmacokinetics, patient demographics and some manufacturing considerations.7–10 Consequently, the efficacy of UFH needs to be monitored to ensure achieving the desired level of therapeutic activity. This can be tested by checking either the activated partial thromboplastin time (aPTT) or activated clotting time (ACT), with the ACT being the most widely used test in the cath lab due to fast results and cost-effectiveness when compared with aPTT.11 Practice guidelines recommend an initial heparin bolus dose between 70 and 100 U/kg to achieve a target ACT of 250–300 seconds.12,13 In order to achieve and maintain therapeutic levels during the procedure, repeat boluses of UFH are often required, as directed by ACT checks.
It has been the subjective observation of the interventional team in this centre that the amount of UFH required during PCI procedures has increased over the last few years, and the aim of this study was to assess this notion objectively.
Method
This study is a retrospective analysis of a total of 900 patients who underwent isolated PCI at University Hospital Southampton NHS Trust (UHS) between 2016 and 2024. Specifically, we studied the first 100 consecutive patients who fulfilled the inclusion criteria for each calendar year starting from 1 January. The project has been registered as a formal clinical practice audit at UHS and, therefore, does not require ethical approval. Data sources were the national British Cardiovascular Intervention Society (BCIS) database; the local UHS catheter lab electronic procedure database, which is completed in real time by the cardiac physiologist and includes a complete record for procedure time, drug administration and ACT measurements; and the electronic case records at UHS.
Patient population
For each year, 100 consecutive, suitable PCI patients were identified and the data collected from 1 January onwards. The 900 patients included in the analysis underwent PCI for either acute (ST-elevation myocardial infarction [STEMI], non-ST-elevation myocardial infarction [NSTEMI]) or chronic (stable or unstable angina) coronary syndromes, with no relative weighting for the indication during the data collection phase. All patients received dual antiplatelet therapy (aspirin and a P2Y12-receptor blocker) prior to the procedure. The inclusion criteria were isolated PCI and evidence of at least one ACT test during the procedure. Patients with incomplete data, those undergoing other procedures (such as transcatheter aortic valve implantation [TAVI]) and those who received glycoprotein IIb/IIIa inhibitors were excluded. Supplementary table 1 provides patient demographics, and table 1 provides PCI indications.
Supplementary table 1. Demographics of population included in this analysis
| Characteristics | 2016, N=100* |
2017, N=100* |
2018, N=100* |
2019, N=100* |
2020, N=100* |
2021, N=100* |
2022, N=100* |
2023, N=100* |
2024, N=100* |
p value† | |
| Age | Mean (SD) | 65 (12) | 66 (11) | 66 (12) | 65 (11) | 65 (11) | 65 (12) | 67 (13) | 65 (12) | 68 (11) | 0.5 |
| Median (IQR) | 66 (58, 73) | 67 (57, 75) | 64 (55, 75) | 64 (56, 73) | 65 (56, 74) | 66 (56, 75) | 67 (57, 77) | 65 (58, 76) | 69 (60, 77) | ||
| Weight | Mean (SD) | 87 (19) | 86 (19) | 83 (17) | 84 (16) | 88 (17) | 85 (16) | 86 (19) | 86 (20) | 84 (19) | 0.5 |
| Median (IQR) | 85 (76, 96) | 84 (73, 99) | 83 (72, 93) | 84 (74, 94) | 88 (78, 95) | 85 (75, 95) | 82 (72, 100) | 83 (72, 100) | 82 (72, 95) | ||
| BMI | Mean (SD) | 29.2 (5.7) | 28.8 (5.2) | 28.4 (4.9) | 30.4 (19.4) | 29.6 (5.3) | 28.7 (4.8) | 29.3 (5.3) | 28.8 (6.0) | 29.7 (21.5) | 0.3 |
| Median (IQR) | 27.8 (25.4, 31.8) |
29.0 (25.4, 32.0) |
27.5 (25.1, 31.0) |
28.2 (24.2, 31.2) |
29.3 (26.3, 32.7) |
28.1 (25.2, 31.7) |
29.0 (25.3, 32.9) |
28.1 (25.2, 31.8) |
27.1 (24.6, 30.2) |
||
| Diabetes mellitus | 16/100 (16%) | 15/100 (15%) | 21/100 (21%) | 21/100 (21%) | 21/100 (21%) | 21/100 (21%) | 17/100 (17%) | 15/100 (15%) | 13/100 (13%) | 0.7 | |
| Hypertension | 53/100 (53%) | 41/100 (41%) | 48/100 (48%) | 41/100 (41%) | 46/100 (46%) | 43/100 (43%) | 42/100 (42%) | 32/100 (32%) | 32/100 (32%) | 0.051 | |
| Previous PCI | 14/100 (14%) | 9/100 (9.0%) | 15/100 (15%) | 11/100 (11%) | 7/100 (7.0%) | 7/100 (7.0%) | 7/100 (7.0%) | 12/100 (12%) | 4/100 (4%) | 0.13 | |
| Previous CABG | 4/100 (4%) | 7/100 (7.0%) | 6/100 (6.0%) | 5/100 (5.0%) | 1/100 (1.0%) | 1/100 (1.0%) | 2/100 (2.0%) | 4/100 (4%) | 2/100 (2.0%) | 0.2 | |
| Hyper-cholesterolaemia | 42/100 (42%) | 21/100 (21%) | 57/100 (57%) | 47/100 (47%) | 18/100 (18%) | 26/100 (26%) | 16/100 (16%) | 25/100 (25%) | 18/100 (18%) | <0.001 | |
| Renal impairment (eGFR <60) |
5/100 (5.0%) | 11/100 (11%) | 10/100 (10%) | 5/100 (5.0%) | 12/100 (12%) | 20/100 (20%) | 16/100 (16%) | 18/100 (18%) | 10/100 (10%) | 0.006 | |
| * n/N (%) † Kruskal-Wallis rank-sum test Key: BMI = body mass index; CABG = coronary artery bypass graft; PCI = percutaneous coronary intervention |
|||||||||||
Table 1. Indications for percutaneous coronary intervention (PCI) in the population involved in this analysis
| Indication | 2016 N=100 |
2017 N=100 |
2018 N=100 |
2019 N=100 |
2020 N=100 |
2021 N=100 |
2022 N=100 |
2023 N=100 |
2024 N=100 |
p value |
| Chronic | 35 (35%) |
25 (25%) |
25 (25%) |
24 (24%) |
24 (24%) |
16 (16%) |
30 (30%) |
16 (16%) |
23 (23%) |
0.036 |
| STEMI | 36 (36%) |
37 (37%) |
40 (40%) |
36 (36%) |
32 (32%) |
53 (53%) |
38 (38%) |
51 (51%) |
45 (45%) |
|
| NSTEMI | 29 (29%) |
38 (38%) |
35 (35%) |
40 (40%) |
44 (44%) |
31 (31%) |
32 (32%) |
33 (33%) |
32 (32%) |
|
| Key: NSTEMI = non-ST-elevation myocardial infarction; STEMI = ST-elevation myocardial infarction | ||||||||||
Heparin dose
All heparin doses and ACT measurements for procedures were assessed from the contemporary record on the cardiac physiology database. Total heparin dose was calculated for the duration of each PCI procedure. The definition of ‘duration of the procedure’ is calculated from the administration of the first heparin dose until the decannulation of the coronary artery treated. Heparin dose was adjusted according to procedure duration and patient weight, which is recorded routinely in the physiologist database.
End points
The primary analysis included the total heparin dose administered during each procedure, and the total heparin dose given adjusted to both body weight and the duration of the procedure and represented as ‘unit/kg/min’. A secondary outcome assessed similar analyses only in patients in whom an ACT of >250 seconds was achieved (which is the minimal target level at this centre).
Statistical analysis
Statistical analysis was carried out using RStudio version 4.4.1, PBC (Boston, Massachusetts, USA). Continuous data are presented or median (interquartile range [IQR]), as appropriate, depending on data distribution. Categorical data are presented as frequency and percentage. Characteristics were compared using the Kruskal-Wallis rank-sum test, for continuous variables, and Pearson chi-square test or Fisher-exact test, for discrete variables, as appropriate.
Results
Primary analysis: total heparin dose administered
There is a significant increase in the median total heparin dose administered from 2016 (9,000 U, IQR 7,000–11,000 U) to 2024 (12,000 U, IQR 10,000–15,000 U) (p<0.001) (table 2). Figure 1 provides a comparison of median heparin dose, and supplementary figure 1 provides a median + IQR comparison. The rise in dose was most marked until 2020.
Table 2. Median and interquartile range (IQR) assessment of the total heparin dose represented in 1,000 units, per year, among the entire population participating in the analysis between 2016 and 2024 (N=900)
| 2016 N=100 |
2017 N=100 |
2018 N=100 |
2019 N=100 |
2020 N=100 |
2021 N=100 |
2022 N=100 |
2023 N=100 |
2024 N=100 |
p value* | |
| Median (IQR) | 9 (7–11) |
9 (7–12) |
9 (7–11) |
10 (8–13) |
12 (9.8–14) |
12 (10–15) |
12 (10–15) |
12.5 (10–15.1) |
12.0 (10–15) |
<0.001 |
| * Kruskal-Wallis rank-sum test | ||||||||||

Weight- and procedure time-adjusted total heparin dose as unit/kg/min
The median adjusted total heparin dose has significantly increased from 1.95 (IQR 1.44–2.77) U/kg/min in 2016, to 2.93 (IQR 2.1–3.8) U/kg/min in 2024 (figure 2, also supplementary table 2 and supplementary figure 2).

Supplementary table 2. Median and IQR assessment of total heparin dose adjusted to individual body weight in kilograms (kg) and procedure duration in minutes (min) and represented as unit/kg/min, between 2016 and 2024, across the entire population participating in the analysis (N=900)
| 2016 N=100* |
2017 N=100* |
2018 N=100* |
2019 N=100* |
2020 N=100* |
2021 N=100* |
2022 N=100* |
2023 N=100* |
2024 N=100* |
p value† | |
| Median (IQR) | 1.95 (1.44–2.77) |
2.12 (1.60–2.69) |
2.48 (1.65–3.31) |
2.39 (1.76–3.24) |
2.74 (2.00–3.39) |
3.01 (2.32–4.02) |
2.85 (2.16–4.04) |
2.60 (2.01–3.38) |
2.93 (2.10–3.80) |
<0.001 |
| * n/N (%) † Kruskal-Wallis rank-sum test |
||||||||||
Secondary analysis: total heparin dose adjusted to weight and procedure duration in patients who had at least a single ACT value >250 seconds
This secondary analysis included 493 patients (with a range between 40 cases in 2019 and 70 cases in 2023) who had at least a single ACT value >250 seconds, with the total administered heparin dose adjusted to weight and procedure duration (supplementary table 3). This analysis showed a significant increase in the median dose from 1.81 (IQR 1.21–2.24) U/kg/min in 2016 versus 2.59 (IQR 2.03–3.22) U/kg/min in 2024 (p<0.001), although this rise peaked in 2021 (figure 3, also supplementary table 3 and supplementary figure 3).
Supplementary table 3. Median and IQR assessment of total heparin dose adjusted to individual body weight in kilograms (kg) and procedure duration in minutes (min) and represented as unit/kg/min, between 2016 and 2024, in patients who achieved ACT >250 seconds (N=493)
| 2016 N=49* |
2017 N=59* |
2018 N=45* |
2019 N=40* |
2020 N=50* |
2021 N=58* |
2022 N=65* |
2023 N=70* |
2024 N=57* |
p value† | |
| Median (IQR) | 1.81 (1.21–2.24) |
1.93 (1.47–2.32) |
1.72 (1.41–2.50) |
1.98 (1.53–2.59) |
2.24 (1.62–2.93) |
2.60 (1.99–3.14) |
2.37 (1.78–3.38) |
2.50 (1.90–3.08) |
2.59 (2.03–3.22) |
<0.001 |
| * n/N (%) † Kruskal-Wallis rank-sum test |
||||||||||

Discussion
This single-centre study has, for the first time to our knowledge, demonstrated that the heparin dosage used during PCI procedures has indeed increased from 2016. This confirms a widely discussed subjective observation made by clinicians here, and in other centres.
Clinical guidelines recommend an initial loading dose for UFH of 70–100 U/kg. The use of ACT monitoring during cases to assess the efficacy of UFH is recommended. The literature suggests that there is a therapeutic window for UFH dosing to achieve low bleeding risk but effective anticoagulation. For example, one meta-analysis reported outcomes of 5,216 patients from six randomised-controlled trials that were originally designed to assess novel pharmacotherapies in the setting of PCI, compared with aspirin and UFH in the control arm. There was a 34% relative risk reduction for composite ischaemic events (death, myocardial infarction [MI], urgent revascularisation) at seven days in the group with ACT levels between 350–375 seconds, compared with those with levels between 171 and 295 seconds. The lowest level of bleeding (8.6%) was observed in the range of 325 to 350 seconds, and it progressively increased to 12.4% at 350 to 375 seconds. By contrast, a meta-analysis15 that assessed the outcomes of 8,369 patients, recruited in four large PCI clinical trials who were treated with UFH during their procedures achieving a median ACT of 297 (IQR 256–348) seconds, showed that the covariate-adjusted rate of ischaemic complications did not correlate with maximal procedural ACT. There was, however, an increased risk of minor and major bleeding in patients who received a high dose of UFH (5,000 U, or up to 90 U/kg).
The current analysis was motivated by a concern among our clinical group that the overall amount of UFH that we needed to give to achieve the therapeutic target has increased over time. Furthermore, we inevitably speculated that the strength of the effect of UFH may also have reduced. For example, in the EPILOG (Evaluation in PTCA to Improve Long-term Outcome with abciximab GP IIb/IIIa blockade) trial,16 published in 1997, an initial bolus of 100 U/kg achieved a median ACT in the whole population of 329 seconds with an IQR of 311–358. This level of consistency of response has not been a feature of our clinical practice in recent years. This study has confirmed that the required dose of UFH has indeed increased since 2016. The reason for this increase is unclear. One obvious possibility is that the strength of the heparin that we are using has indeed diminished due, perhaps, to changes in manufacturing and relative dilution of the product. Regardless, our study suggests that it is important to use ACT guidance during PCI in order to achieve the local therapeutic target.
There are several important limitations to this analysis. First, it includes all patients undergoing PCI, regardless of the indication for the procedure, or its complexity. Second, the results were not adjusted for risk factors, including kidney function. Third, the doses of UFH given and frequency of ACT monitoring were completely at the discretion of the supervising interventional cardiologist, and the awareness of the need to monitor may have increased as concern about heparin dose rose.
In conclusion, this study confirms that the average dose of heparin given during PCI has increased significantly in our centre since 2016.
Key messages
- The efficacy of heparin administered during coronary intervention is integral to reducing thrombosis risk
- Multiple factors can contribute to the variability in heparin efficacy
- The efficacy of heparin given is best checked by activated clotting time (ACT)
- Multiple heparin doses are usually required to achieve and maintain target ACT
- It is noted through this work that, over the years, more heparin doses were required to achieve the target ACT levels during percutaneous coronary intervention (PCI) procedures at University Hospital Southampton NHS Trust
Conflicts of interest
None declared.
Funding
None.
Study approval
The project was registered as a formal clinical practice audit at UHS and, therefore, did not require ethical approval.
Editors’ note
Supplementary materials are available online.
References
1. Drugbank. Heparin. Available at: https://go.drugbank.com/drugs/DB01109 [cited 18 June 2024].
2. Mandal A. Heparin history. News Medical Life Sciences, 20 June 2023. Available at: https://www.news-medical.net/health/Heparin-History.aspx [cited 18 June 2024].
3. Heestermans M, Poenou G, Hamzeh-Cognasse H, Cognasse F, Bertoletti L. Anticoagulants: a short history, their mechanism of action, pharmacology, and indications. Cells 2022;11:3214. https://doi.org/10.3390/cells11203214
4. Zeymer U, Rao SV, Montalescot G. Anticoagulation in coronary intervention. Eur Heart J 2016;37:3376–85. https://doi.org/10.1093/eurheartj/ehw061
5. Rao SV, Ohman EM. Anticoagulant therapy for percutaneous coronary intervention. Circ Cardiovasc Interv 2010;3:80–8. https://doi.org/10.1161/CIRCINTERVENTIONS.109.884478
6. Dauerman HL. Anticoagulation strategies for primary percutaneous coronary intervention: current controversies and recommendations. Circ Cardiovasc Interv 2015;8:e001947. https://doi.org/10.1161/CIRCINTERVENTIONS.115.001947
7. Naranjo CA, Sellers EM, Khouw V, Alexander P, Fan T, Shaw J. Variability in heparin effect on serum drug binding. Clin Pharmacol Ther 1980;28:545–50. https://doi.org/10.1038/clpt.1980.201
8. Doganer O, Jongkind V, Blankensteijn JD, Yeung KK, Wiersema AM. A standardized bolus of 5 000 IU of heparin does not lead to adequate heparinization during non-cardiac arterial procedures. Ann Vasc Surg 2021;71:280–7. https://doi.org/10.1016/j.avsg.2020.07.035
9. Krishnaswamy A, Lincoff AM, Cannon CP. The use and limitations of unfractionated heparin. Crit Pathw Cardiol 2010;9:35–40. https://doi.org/10.1097/HPC.0b013e3181d29713
10. Manson L, Weitz JI, Podor TJ, Hirsh J, Young E. The variable anticoagulant response to unfractionated heparin in vivo reflects binding to plasma proteins rather than clearance. J Lab Clin Med 1997;130:649–55. https://doi.org/10.1016/S0022-2143(97)90115-3
11. Simko RJ, Tsung FFW, Stanek EJ. Activated clotting time versus activated partial thromboplastin time for therapeutic monitoring of heparin. Ann Pharmacother 1995;29:1015–21. https://doi.org/10.1177/106002809502901012
12. Neumann FJ, Sousa-Uva M, Ahlsson A et al. 2018 ESC/EACTS guidelines on myocardial revascularization. Eur Heart J 2019;40:87–165. https://doi.org/10.1093/eurheartj/ehy394
13. Lawton JS, Tamis-Holland JE, Bangalore S et al. 2021 ACC/AHA/SCAI guideline for coronary artery revascularization: a report of the American College of Cardiology/American Heart Association Joint Committee on Clinical Practice Guidelines. Circulation 2022;145:E18–E114. https://doi.org/10.1161/CIR.0000000000001060
14. Chew DP, Bhatt DL, Lincoff AM et al. Defining the optimal activated clotting time during percutaneous coronary intervention. Circulation 2001;103:961–6. https://doi.org/10.1161/01.CIR.103.7.961
15. Brener SJ, Moliterno DJ, Lincoff AM, Steinhubl SR, Wolski KE, Topol EJ. Relationship between activated clotting time and ischemic or hemorrhagic complications. Circulation 2004;110:994–8. https://doi.org/10.1161/01.CIR.0000139868.53594.24
16. EPILOG Investigators. Platelet glycoprotein IIb/IIIa receptor blockade and low-dose heparin during percutaneous coronary revascularization. N Engl J Med 1997;336:1689–97. https://doi.org/10.1056/NEJM199706123362401


