Introduction
The mainstay of diagnosis in heart valve disease is imaging, using transthoracic echocardiography.1,2 This module describes the information required from echocardiography to diagnose heart valve disease and inform decisions about further management. It also discusses the complementary information available from cardiac magnetic resonance (CMR) and computed tomography (CT) imaging.
Aortic stenosis
The minimum echocardiographic data set
The echocardiographic minimum dataset for aortic stenosis consists of:
- a detailed description of the valve appearance and mobility
- Doppler parameters including peak velocity, mean gradient, and effective orifice area (EOA) calculated using the continuity equation:3,4
EOA = CSA LVOT x (VTI LVOT / VTIAV)
(where AV = aortic valve; CSA = cross sectional area; EOA = effective orifice area; LVOT = left ventricular outflow tract; VTI = velocity-time integral)
- aortic size
- left ventricular geometry and function
- pulmonary artery pressure and right ventricular function.
Grading on echocardiography

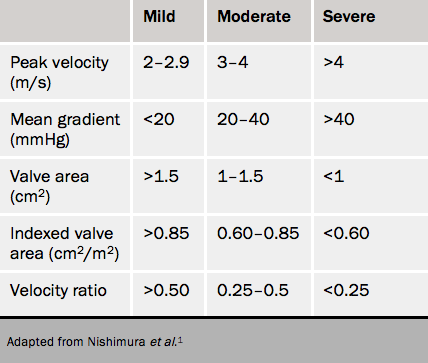
The cut-offs for grading can be found in table 1. Discrepancies are common and are usually caused by:
- incorrect measurements
- high or low flow
- extremes of body size.
In addition, there is evidence that in European populations the cut-off maximum velocity (V max) of 4.0 m/s and mean gradient 40 mmHg coincide better with an EOA of 0.8 cm2 rather than 1.0 cm2.
The first step is to check measurements:
Is the LV outflow diameter too small? This can occur if there is a prominent subaortic septal bulge. Take the diameter at or close to the echocardiographic annulus at the base of the cusps.
There is recent data showing that the LV outflow tract may be oval rather than circular in cross-section in some patients. The continuity equation can be corrected by measuring the area directly using 3D echocardiography or CT. Check that the pulsed sample has been placed in the LV outflow tract just apical to the valve where the colour starts to alias. Pacing this too apical will cause an erroneously low effective orifice area.
Has continuous wave been recorded using a stand-alone probe from at least apical and right intercostal windows?
The key to resolving the discrepancies is to look at the valve and the waveform shape.
Severe area (<1.0 cm2) and moderate gradient (mean <40 mmHg)
The most common situation is an EOA of about 0.9 cm2 with V max 3.5–3.9 m/s in the presence of apparently normal LV systolic function. If the waveform is dagger-shaped and the valve opens well, this is moderate aortic stenosis (AS).
It can also help to index EOA to body surface area (BSA) (see table 1). An EOA of 1.3 cm2 (apparently moderate) in a small person (BSA 1.5 m2) gives an effective orifice area index (EOAi) of 0.86 cm2/m2 (mild AS), while in a big person (BSA 2.5 m2) the EOAi is 0.52 cm2/m2 (severe AS).
If the valve does not open well, look at the LV and check the velocity-time integral (VTI). If the ejection fraction (EF) is <40% or the VTI is low (<15 cm), this is low flow AS.5 A stress echocardiogram (see figure 1) should be considered.
