Sickle cell disease (SCD) is an inherited haematologic disorder with cardiac-related complications. Cardiac magnetic resonance (CMR) imaging allows us to assess the cardiac morphology and function of this population. Our aim was to better characterise phenotypic variations among SCD patients utilising CMR data.
This retrospective study included 72 patients with SCD who underwent CMR between May 2013 and July 2023. We recorded baseline characteristics, medical history, and indication and setting of CMR. CMR parameters relating to morphology and function were collected. Patients were placed into the following groups based on cardiac parameters on CMR: high output, pulmonary hypertension (PH; defined by mean pulmonary artery pressure >20 mmHg on right heart catheterisation or elevated tricuspid regurgitation velocity >3.4 m/s on echocardiogram), left ventricular (LV) dysfunction, or normal size and function. Between- and within-group comparisons were performed.
Demographic data were similar among groups. The PH group was more likely to have a history of smoking, chronic hypoxia, lower baseline haemoglobin, and need for blood transfusion (p<0.05 for all). There were significant between-group differences in CMR structural and function parameters.
In conclusion, sickle cell patients present with different cardiac phenotypes. Patients with PH are associated with significantly higher morbidities.
Introduction
Sickle cell disease (SCD) is the most common inherited haematologic disorder in the US, affecting over 100,000 individuals.1,2 In SCD, deoxygenated haemoglobin S (HbS) polymerisation leads to sickling and destruction of red blood cells. Patients experience profound anaemia and vaso-occlusive events. Prolonged capillary inflammation and repeated episodes of ischaemia and reperfusion result in chronic end-organ damage, including the heart and lungs.3 Sickle cell cardiomyopathy contributes to the significant morbidity and mortality among adult patients with SCD. A study by Hamideh and colleagues revealed that 31.6% of total death certificates among Blacks with SCD may be attributed to cardiovascular etiologies, i.e. congestive heart failure, ischaemic heart disease, hypertensive heart disease, or arrhythmias.4
Within cardiac pathophysiology of SCD, considerable attention has focused on the mechanism of high output heart failure. Chronic anaemia and compensatory haematopoiesis promotes dilation of peripheral vessels, activation of the renin–angiotensin–aldosterone system, and a haemodynamic overload state.5 The heart responds with progressive chamber dilation, elevated filling pressures, hypertrophic remodelling, and eventually clinical heart failure. To address chronic anaemia, patients are often treated with repeated blood transfusions, placing them at a higher risk for further volume overload and related complications.6
In more recent years, other manifestations of SCD-related cardiac involvement have been highlighted, including pulmonary hypertension (PH) and left ventricular dysfunction (LVD). The mechanisms involved in SCD-related PH are likely a combination of pre- and post-capillary hypertension.7 Post-capillary PH is thought to be secondary to the elevated pulmonary venous pressures from high cardiac output and chronic volume overload. In contrast, pre-capillary PH may be the result of decades of intravascular haemolysis and subsequent pulmonary arterial vasculopathy.8
Similarly, multiple mechanisms for LVD in SCD patients have been proposed. LVD was previously speculated to be driven by iron overload from repeated transfusions. In a study by Desai et al., however, sickle cell cardiomyopathy was rarely characterised by myocardial iron overload. Only 2–5% of SCD patients receiving chronic transfusions were found to have dilated cardiomyopathy and reduced ejection fractions.6 Cardiac magnetic resonance (CMR) and post-mortem studies instead highlight microvascular ischaemic damage and subsequent myocardial fibrosis as the more likely mechanism of LVD seen in this population.9,10
CMR is a powerful imaging tool that can be used to assess the cardiac structure and function of SCD patients, and it is the gold standard for tissue characterisation (i.e. scar, fibrosis, necrosis, inflammation), myocardial viability, and volumetric analyses.11 Our study aims to utilise CMR data to better characterise the phenotypic variations seen among SCD patients.
Method
We conducted a retrospective study of patients with SCD who were treated at the Ohio State University Wexner Medical Center in Columbus, Ohio. Patients aged 18 years or above who underwent CMR between May 2013 and July 2023 were included. Baseline characteristics, including demographic information, medical history, indication and setting of baseline CMR, were collected. Baseline haemoglobin (Hb) was defined by the Hb level at steady state within the year that CMR was obtained. Haemoglobin or ferritin at time of CMR was defined as the Hb or ferritin level on the date of CMR, or within one month of CMR if no laboratory data were available on the date of CMR.
CMR cine imaging, tissue characterisation, and late gadolinium imaging were obtained, as clinically indicated, and reported according to standard protocol. Ventricular volumes and masses were normalised for each patient’s body surface area. We obtained the following CMR parameters: left ventricular (LV) end-diastolic volume index (EDVi), LV end-systolic volume index (ESVi), LV ejection fraction (EF), LV mass index, right ventricular (RV) end-diastolic volume index (RVEDVi), RV end-systolic volume index (RVESVi), RVEF, LV T1, T2, T2*, and late gadolinium enhancement (LGE) presence when available.
LVD was defined as a LVEF <55%. High cardiac output was defined as a cardiac output index >4 L/min/m2. PH was defined as mean pulmonary artery pressure (mPAP) >20 mmHg on right heart catheterisation or elevated tricuspid regurgitation velocity (TRV) >3.4 m/s on the most recent echocardiogram preceding, but within six months of the date of baseline CMR. Patients were separated into the following functional groups based on parameters related to cardiac size and function by CMR: high output (HO), PH, LVD, or ‘normal’ representing normal size and function. Patients were assigned to a single group.
Qualitative data were expressed as counts and percentages. Quantitative data were expressed as median and interquartile ranges (IQR). Fisher’s exact test was used for categorical variables. Kruskal-Wallis test was used for comparison of continuous variables. Post-hoc pairwise comparisons were completed using Dunn’s Bonferroni adjustment. A logistic-regression model was used to determine the relationship between binary-dependent variables and the cardiac parameters. A p value <0.05 was considered statistically significant. Statistical analyses were performed using Stata (Stata 15.0, StataCorp, College Station, Texas, USA). The Institutional Review Board approved this research protocol.
Results
We identified 91 patients with SCD who underwent CMR at our institution. Six were removed due to having the sickle cell trait genotype. Thirteen were removed due to having insufficient baseline data or inadequate imaging data (i.e. artifact on CMR, unable to complete entire exam, missing CMR parameters, imaging study unavailable on electronic records). We included 72 patients (61% female, median age at baseline CMR was 32 years, IQR 27–42 years) who underwent CMR at our institution between May 2013 and July 2023. Among the patients included in this cohort, 24 patients had >1 follow-up CMR. Sickle cell genotypes included SS (83%), SC (13%), and S beta thalassaemia zero (4%). Median baseline Hb for all patients was 8.5 (range 4.5–13.5) g/dL. Median Hb at time of CMR was 8.5 (range 5.0–14.2) g/dL. There were 14 (19%) patients in the HO group (79% female; median age 30 years, IQR 24–35 years), 32 (44%) patients in the PH group (53% female; median age 33 years, IQR 29–44 years), 13 (18%) patients in the LVD group (46% female; median age 38 years, IQR 25–43 years), and 13 (18%) patients in the normal group (77% female; median age 30 years, IQR 27–38 years). There were no significant differences detected in age or sex distribution among the groups.
Tables 1 and 2 present a summary of patient characteristics, as well as the indication and setting of CMR. Twenty-one (29%) CMRs were completed in the inpatient setting. Thirty-four (47%) patients reported symptoms, including chest pain or shortness of breath, at time of baseline CMR. Indications for CMR included monitoring of cardiomyopathy, monitoring of microvascular disease, assessment of iron content, elevated troponin, and new symptoms. There were no significant differences detected in indication, symptoms, or setting of CMR among groups. There was a significant difference among groups in smoking history (p=0.005), chronic hypoxia (p=0.009), supplemental oxygen use (p=0.028), and mean Hb (p=0.016). Among the PH group, 59% reported a former or current history of smoking, compared with 8% observed in the normal group. Additionally, 41% of patients in the PH group reported chronic hypoxia, with 34% reporting baseline supplemental oxygen use. None of the patients in the normal group reported chronic hypoxia or supplemental oxygen use. The mean Hb at time of baseline CMR was significantly different among the four groups (HO, PH, LVD, normal): 8.7 ± 1.7, 7.8 ± 1.9, 9.4 ± 2.0, and 9.5 ± 2.2 g/dL, respectively (p=0.016). The PH group had a significantly lower mean Hb compared with the LVD group. Among patients with iron monitoring as an indication for CMR, median ferritin at time of CMR was 2,381.9 ng/ml. There was no significant difference in other medical history, including diabetes mellitus, asthma, pulmonary embolism, obstructive sleep apnoea, acute coronary syndrome, cerebral vascular disease, hypertension, or hyperlipidaemia. There was no significant difference detected in sickle cell complications (i.e. need for exchange of blood transfusion, history of sickle pain crisis, avascular necrosis, acute chest syndrome) or medication use (i.e. folic acid, hydroxyurea, deferasirox, voxelotor, antihypertensives).
Table 1. Demographics, setting and indication of cardiac magnetic resonance (CMR)
| HO (N=14) | PH (N=32) | LVD (N=13) | Normal (N=13) | p value | |
| Female, n (%) | 11 (79) | 17 (53) | 6 (46) | 10 (77) | 0.155 |
| Median age (IQR), years | 29.5 (24–35) | 33 (29–44) | 38 (25–43) | 30 (27–38) | 0.524 |
| Inpatient setting, n (%) | 2 (14) | 15 (47) | 2 (15) | 2 (15) | 0.047* |
| Indication, n (%) | |||||
| Monitor cardiomyopathy | 2 (14) | 7 (22) | 4 (31) | 2 (15) | 0.766 |
| Monitor microvascular disease | 6 (43) | 5 (16) | 3 (23) | 3 (23) | 0.265 |
| Assess iron content | 3 (21) | 11 (34) | 4 (31) | 5 (38) | 0.797 |
| Elevated troponin | 1 (7) | 3 (9) | 1 (8) | 1 (8) | 1.000 |
| New symptoms | 2 (14) | 6 (19) | 1 (8) | 2 (15) | 0.963 |
| * Indicates no significant difference on pairwise comparison. Key: HO = high output; IQR = interquartile range; LVD = left ventricular dysfunction; PH = pulmonary hypertension |
|||||
Table 2. Baseline medical history
| Condition, n (%) | HO (N=14) | PH (N=32) | LVD (N=13) | Normal (N=13) | p value |
| Smoking history (former and current) | 4 (29) | 19 (59)* | 7 (54) | 1 (8)* | 0.005 |
| Diabetes mellitus | 0 (0) | 4 (13) | 2 (15) | 2 (15) | 0.506 |
| Asthma | 8 (57) | 13 (41) | 5 (38) | 2 (15) | 0.174 |
| Pulmonary embolism | 4 (29) | 9 (28) | 4 (31) | 2 (15) | 0.846 |
| Obstructive sleep apnoea | 1 (7) | 3 (9) | 1 (8) | 3 (23) | 0.668 |
| Acute coronary syndrome | 1 (7) | 10 (31) | 2 (15) | 1 (8) | 0.197 |
| Stroke | 4 (29) | 8 (25) | 6 (46) | 3 (23) | 0.546 |
| Hypertension | 5 (36) | 17 (53) | 7 (54) | 5 (38) | 0.639 |
| Hyperlipidaemia | 1 (7) | 9 (28) | 5 (38) | 2 (15) | 0.205 |
| Chronic hypoxia | 3 (21) | 13 (41) | 1 (8) | 0 (0) | 0.009 |
| Supplemental oxygen use | 2 (14) | 11 (34)* | 1 (8) | 0 (0)* | 0.028 |
| Mean haemoglobin ± SD, g/dL | 8.7 ± 1.7 | 7.8 ± 1.9* | 9.4 ± 2.0* | 9.5 ± 2.2 | 0.016 |
| History of exchange transfusion | 8 (57) | 22 (69) | 10 (77) | 7 (54) | 0.555 |
| History of blood transfusion | 14 (100) | 32 (100) | 12 (92) | 12 (92) | 0.163 |
| History of sickle pain crisis | 13 (93) | 31 (97) | 13 (100) | 12 (92) | 0.667 |
| History of avascular necrosis | 4 (29) | 13 (41) | 7 (54) | 6 (46) | 0.609 |
| History of acute chest syndrome | 12 (86) | 28 (88) | 12 (92) | 10 (77) | 0.715 |
| All-cause mortality | 1 (7) | 8 (25) | 2 (15) | 0 (0) | 0.145 |
| * Indicates statistical difference (p<0.05) on pairwise comparison between the denoted groups. Key: HO = high output; LVD = left ventricular dysfunction; PH = pulmonary hypertension; SD = standard deviation |
|||||
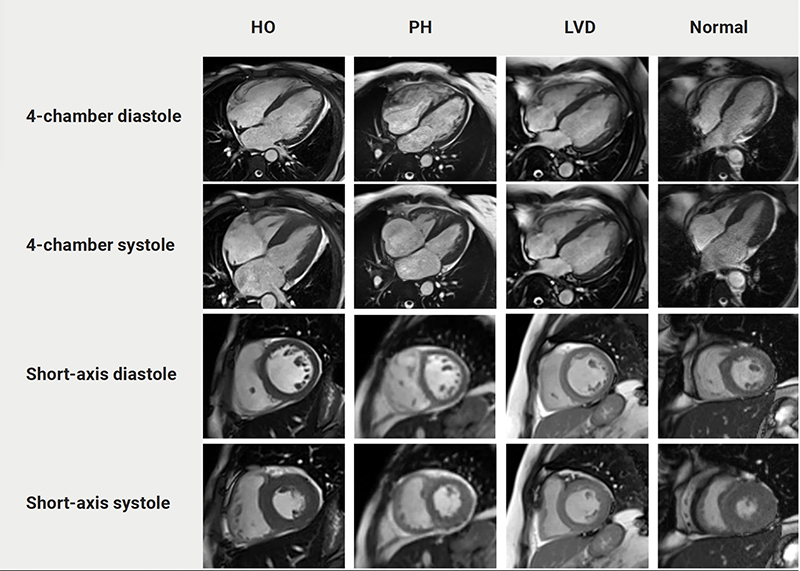
CMR parameters are outlined in table 3. There were significant between-group differences in structural and functional parameters including LVEDVi, LVESVi, LVEF, RVEDVi, RVESVi, and RVEF (p<0.05 for all). Post-hoc pairwise comparison revealed significantly lower LVEDVi, RVEDVi, RVESVi, and RVEF in the PH group compared with the HO and normal groups. There was significantly lower LVESVi in the PH group compared with the HO group. LVEF was similarly lower in both the PH and LVD groups when compared with the HO and normal groups. LV mass index was significantly higher in the PH and LVD groups when compared with the HO group. The p value was <0.05 for all. When assessing for interactions between smoking and hypoxia as it relates to the cardiac parameters, we did not detect any statistically significant interactions. Figure 1 shows representative CMR depictions from each group.
Table 3. Cardiac magnetic resonance (CMR) parameters. Post-hoc pairwise comparison reveals statistical difference (p<0.05) between the denoted groups
| Parameter, mean ± SD |
HO (N=14) |
PH (N=32) |
LVD (N=13) |
Normal (N=13) |
p value | Post-hoc pairwise comparison Mean difference (95%CI); p value |
| LVEDVi | 125.8 ± 26.8 | 103.8 ± 29.5 | 113.4 ± 33.3 | 123.2 ± 26.7 | 0.004 | PH*HO 22.0 (7.6 to 36.5); p=0.008 PH*Normal 19.4 (6.0 to 32.8); p=0.014 |
| LVESVi | 61.3 ± 26.4 | 45.4 ± 16.5 | 54.3 ± 24.3 | 54.9 ± 14.7 | 0.029 | PH*HO 15.9 (4.1 to 27.7); p=0.025 |
| RVEDVi | 125.6 ± 24.8 | 105.0 ± 28.2 | 113.6 ± 32.4 | 134.8 ± 23.1 | 0.003 | PH*HO 20.6 (4.3 to 36.9); p=0.039 PH*Normal 29.8 (12.5 to 47.1); p=0.002 |
| RVESVi | 60.0 ± 21.2 | 47.4 ± 15.7 | 56.6 ± 24.4 | 68.4 ± 16.6 | 0.001 | PH*Normal 21 (10.6 to 31.4); p<0.001 |
| RVEF | 56.4 ± 6.9 | 49.9 ± 8.7 | 52.9 ± 7.7 | 57.4 ± 4.4 | 0.001 | PH*HO 6.5 (2.6 to 10.4); p=0.003 PH*Normal 7.5 (3.0 to 12.0); p=0.003 |
| LVEF | 60.8 ± 4.8 | 52.8 ± 8.7 | 49.1 ± 4.4 | 59.2 ± 3.9 | 0.000 | PH*HO 8.0 (3.3 to 12.7); p=0.003 LVD*HO 11.7 (6.9 to 16.5); p<0.001 PH*Normal 6.4 (1.6 to 11.2); p=0.028 LVD*Normal 10.1 (5.3 to 14.9); p<0.0001 |
| LV mass | 104.9 ± 34.1 | 128.0 ± 39.3 | 125.9 ± 20.0 | 107.1 ± 15.9 | 0.021 | PH*HO 23.1 (4.4 to 41.8); p=0.047 LVD*HO 21.0 (4.8 to 37.2); p=0.034 |
| Key: CI = confidence interval; HO = high output; LV = left ventricular; LVD = left ventricular dysfunction; LVEDVi = left ventricular end-diastolic volume index; LVEF = left ventricular ejection fraction; LVESVi = left ventricular end-systolic volume index; PH = pulmonary hypertension; RVEDVi = right ventricular end-diastolic volume index; RVEF = right ventricular ejection fraction; RVESVi = right ventricular end-systolic volume index | ||||||
| Key: HO = high output; LVD = left ventricular dysfunction; PH = pulmonary hypertension |
Supplemental table 1 demonstrates the LGE and cardiac T1, T2, and T2* mapping data. Eleven CMR studies were completed without contrast to assess for iron overload, and none of these studies revealed evidence of iron overload. Of the remaining studies, LGE was present in four (36.3%) studies of the HO group, 15 (51.7%) of the PH group, seven (70%) of the LVD group, and six (54.5%) of the normal group. There was no significant difference in presence of LGE among groups (p=0.500). T1 mapping was obtained in 12.5% of all studies. There was no significant difference in T1 mapping among the four groups. Approximately half (48.6%) of CMRs commented on T2 mapping. Among those with T2 mapping, three (43%) in the HO group, seven (50%) in the PH group, four (50%) in the LVD group, and two (33%) in the normal group had elevated T2, suggestive of myocardial oedema or inflammation. There was no significant difference in elevated T2 values among the four groups. Myocardial T2* was measured in 49 (68.1%) CMR studies. All studies exhibited normal myocardial T2* values, consistent with absence of myocardial iron overload. Hepatic T2* was measured in 50 (69.4%) CMR studies. Among those with T2* measurements, seven (88%) in the HO group, 20 (83%) in the PH group, eight (100%) in the LVD group, and nine (90%) in the normal group exhibited low T2*, suggestive of hepatic iron overload. There were no significant differences in myocardial or hepatic iron overload among groups.
Supplementary table 1. Late gadolinium enhancement (LGE) and cardiac T1, T2, and T2* mapping data
| Mapping study, n/N (%) | HO | PH | LVD | Normal | p value |
| Presence of LGE | 4/11 (36) | 15/29 (52) | 7/10 (70) | 6/11 (55) | 0.493 |
| Elevated T1 | No studies | 1/4 (25) | 1/2 (50) | 0/3 (0) | 0.411 |
| Elevated T2 | 3/7 (43) | 7/14 (50) | 4/8 (50) | 2/6 (33) | 0.906 |
| Low cardiac T2* | 0/7 (0) | 0/23 (0) | 0/8 (0) | 0/10 (0) | 1.000 |
| Low liver T2* | 7/8 (88) | 20/24 (83) | 8/8 (100) | 9/10 (90) | 0.654 |
| Data are reported as n/total available studies (%). Key: HO = high output; LVD = left ventricular dysfunction; PH = pulmonary hypertension |
|||||
Discussion
In the present study, we showed that SCD patients present with variable cardiac phenotypes. Based on our analysis of CMR parameters, patients were placed into one of the following functional groups: HO, PH, LVD, and normal. The patients with PH had significantly higher morbidities.
The prevalence of PH in our cohort was 44%. This is a much higher prevalence compared with other studies, which range from 12% to 32%.12–15 Among our PH group, we witnessed an elevated LV mass index (128.0 g/m2), lower mean RVEF (49.9%), and lower biventricular volumes including LVEDVi, LVESVi, RVEDVi, and RVESVi. We believe these results may be related to the degree of ventricular remodelling and hypertrophy seen in more advanced SCD-related cardiomyopathy. Interestingly, the PH group had a lower RVEDVi when compared with the HO and normal groups. In pulmonary arterial hypertension (PAH; WHO group 1), elevated pulmonary artery pressure and vascular resistance increases RV afterload.16 In response, the RV remodels by addition of sarcomeres, resulting in RV hypertrophy, dilation, and ultimately dysfunction. The PH associated with SCD group had lower RVEDVi as compared with the normal group, distinctively different from PAH. We suspect different haemodynamic profiles to be at play between PH in SCD patients and idiopathic PAH. Among those in the PH group, 11 patients had undergone prior right heart catheterisation (RHC), and only one patient fulfilled WHO group 1 criteria for PAH. This supports our suspicion that PH in SCD likely demonstrates a mix of pre-capillary and post-capillary PH, in contrast to the pre-capillary physiology of idiopathic PAH. For example, the primary driver in patients with SCD-related PH may be the high-output state from chronic anaemia, rather than the sustained pulmonary vasoconstriction seen in idiopathic PAH.17 In addition, the variable degree of LV filling pressures and LVD seen among SCD patients with PH may impact the ability of the RV to fill and thus reduce RVEDVi.18 Identification of the relatively normal RV size in SCD patients with PH is significant, as it may lead to poorer recognition of the clinical severity of PH in this patient population.
With regards to LVEF, we noted a significantly lower EF among the PH (52.8%) and LVD (49.1%) groups when compared with the HO and normal groups. A study by Meloni et al. found a LVEF of less than 58.9% to be predictive of future cardiovascular events in patients with SCD. They also found LVEF correlated directly with haemoglobin, suggesting chronic anaemia may suppress LV systolic function.19 At time of baseline CMR, there were no differences in major adverse cardiovascular events among any of our studied groups. Interestingly, however, the PH group in our analysis demonstrated a lower baseline Hb compared with the LVD group (7.8 g/dL vs. 9.4 g/dL, respectively).
Of note, the PH group had the lowest mean Hb when compared with all other groups; this includes the HO group in which elevated output is presumed to be driven primarily by anaemia. We hypothesise this may be due to the multiple mechanisms driving anaemia in the context of PH physiology. For example, SCD patients with PH face accelerated haemolysis due to increased turbulence and shear stress in both the systemic and pulmonary circulations.18,20,21 Haemolysis decreases nitric oxide bioavailability, leading to impaired endothelial function and vascular integrity.21–23 Additionally, the increase in pulmonary vascular resistance and impaired circulation to the lungs may lead to exacerbated tissue hypoxia and severe anaemia.24 In a study by Stauffer et al. nocturnal hypoxaemia in patients with SCD was accompanied by decreased red blood cell deformability, enhanced haemolysis, and worsened anaemia.25 As a result, patients with SCD and PH may exhibit more profound anaemia than those with HO physiology due to both contributions from ongoing haemolysis and hypoxia.
Given the paucity of guidelines for screening and management of SCD-related cardiomyopathy, understanding comorbidities associated with each cardiac phenotype may help clinicians mitigate poorer outcomes. We know from prior studies that PH in SCD significantly increases mortality and is associated with respiratory complications, including acute chest and venous thromboembolism.26–30 Recent data from the Sickle Cell Disease Implementation Consortium (SCDIC) registry highlighted PH as a statistically significant predictor for risk of death.26 It is, therefore, important to discuss modifiable risk factors among this particular SCD phenotype.
Our study revealed SCD patients with PH have a higher prevalence of smoking, chronic hypoxia, and supplemental oxygen use. Smoking causes chronic hypoxia-driven deterioration of the vascular endothelium and lowers the levels of glutathione, a protective erythrocyte antioxidant.3,31 In a study of young adults with SCD, Cohen et al. showed patients that reported infant and current environmental tobacco smoke exposure were more likely to have chronic airway destruction. Similarly, Knight-Madden and colleagues demonstrated that asthma and current smoking were significantly associated with mortality during a 10-year study period, even after adjusting for baseline lower lung function in SCD patients. The consistency of our findings with prior studies highlights the elevated risk experienced by the subset of SCD patients with both PH and current smoking.31,32 Our results suggest patients with SCD should be counselled on smoking cessation. Additionally, creation of smoking cessation programmes within the management framework for SCD patients, and particularly among those with PH, may be of value.
Limitations
The limitations of our study include it being a single-centre small study with retrospective design, as well as the presence of referral bias for CMR imaging. Blood transfusion is an integral component of the treatment plan for patients with SCD. We were unable to analyse the timing of each transfusion in relation to Hb levels and the corresponding dates of CMR. Our study is also cross-sectional, and there is likely some overlap among these phenotypes, as SCD-related cardiomyopathy might advance over time.33 Longitudinal, larger studies utilising CMR imaging may be important in the future to delineate the progression of disease and assess if there is phenotypic evolution over time.
Conclusion
In conclusion, we demonstrate that patients with SCD present with different cardiac phenotypes. Patients with PH are associated with significantly higher morbidities. It is important to highlight modifiable risk factors within this group, including smoking. This study also focuses on a special patient population for which CMR may be a useful, non-invasive tool to assess common pathophysiologic features. Future studies should incorporate prospective data to help understand the progression of cardiomyopathy in this patient population.
Key messages
- Patients with sickle cell disease present with different cardiac phenotypes as demonstrated by cardiac magnetic resonance imaging
- Patients with sickle cell disease exhibiting the pulmonary hypertension phenotype are associated with significantly greater morbidities, including chronic hypoxia and supplemental oxygen use
- Given the paucity of guidelines for the management of sickle cell disease-related cardiomyopathy, an understanding of the modifiable risk factors, such as smoking, may help clinicians mitigate poorer outcomes in this patient population
Conflicts of interest
None declared.
Funding
None.
Study approval
This study protocol was reviewed and approved by the IRB, approval # 2014H0434.
Editors’ note
Supplementary table is available online.
References
1. Piel FB, Hay SI, Gupta S, Weatherall DJ, Williams TN. Global burden of sickle cell anaemia in children under five, 2010–2050: modelling based on demographics, excess mortality, and interventions. PLoS Med 2013;10:e1001484. https://doi.org/10.1371/journal.pmed.1001484
2. Piel FB, Patil AP, Howes RE et al. Global epidemiology of sickle haemoglobin in neonates: a contemporary geostatistical model-based map and population estimates. Lancet 2013;381:142–51. https://doi.org/10.1016/S0140-6736(12)61229-X
3. Helvaci MR, Gokce C, Davran R, Akkucuk S, Ugur M, Oruc C. Mortal quintet of sickle cell diseases. Int J Clin Exp Med 2015;8:11442–8. https://doi.org/10.5742/MEIM.2015.92655
4. Hamideh D, Alvarez O. Sickle cell disease related mortality in the United States (1999–2009). Pediatr Blood Cancer 2013;60:1482–6. https://doi.org/10.1002/pbc.24557
5. Reddy YNV, Borlaug BA. High-output heart failure in sickle cell anemia. JACC Cardiovasc Imaging 2016;9:1122–3. https://doi.org/10.1016/j.jcmg.2016.04.004
6. Kaur H, Aurif F, Kittaneh M, Chio JPG, Malik BH. Cardiomyopathy in sickle cell disease. Cureus 2020;12:e9619. https://doi.org/10.7759/cureus.9619
7. Anthi A, Machado RF, Jison ML et al. Hemodynamic and functional assessment of patients with sickle cell disease and pulmonary hypertension. Am J Respir Crit Care Med 2007;175:1272–9. https://doi.org/10.1164/rccm.200610-1498OC
8. Savale L, Habibi A, Lionnet F et al. Clinical phenotypes and outcomes of precapillary pulmonary hypertension of sickle cell disease. Eur Respir J 2019;54:1900585. https://doi.org/10.1183/13993003.00585-2019
9. Niss O, Fleck R, Makue F et al. Association between diffuse myocardial fibrosis and diastolic dysfunction in sickle cell anemia. Blood 2017;130:205–13. https://doi.org/10.1182/blood-2017-02-767624
10. Desai AA, Patel AR, Ahmad H et al. Mechanistic insights and characterization of sickle cell disease-associated cardiomyopathy. Circ Cardiovasc Imaging 2014;7:430–7. https://doi.org/10.1161/CIRCIMAGING.113.001420
11. Busse A, Rajagopal R, Yucel S et al. Cardiac MRI-update 2020. Radiologe 2020;60(suppl 1):33–40. https://doi.org/10.1007/s00117-020-00687-1
12. Nelson SC, Adade BB, McDonough EA, Moquist KL, Hennessy JM. High prevalence of pulmonary hypertension in children with sickle cell disease. J Pediatr Hematol Oncol 2007;29:334–7. https://doi.org/10.1097/MPH.0b013e31805d8f32
13. Parent F, Bachir D, Inamo J et al. A hemodynamic study of pulmonary hypertension in sickle cell disease. N Engl J Med 2011;365:44–53. https://doi.org/10.1056/NEJMoa1005565
14. Aliyu ZY, Gordeuk V, Sachdev V et al. Prevalence and risk factors for pulmonary artery systolic hypertension among sickle cell disease patients in Nigeria. Am J Hematol 2008;83:485–90. https://doi.org/10.1002/ajh.21162
15. Gladwin MT, Sachdev V, Jison ML et al. Pulmonary hypertension as a risk factor for death in patients with sickle cell disease. N Engl J Med 2004;350:886–95. https://doi.org/10.1056/NEJMoa035477
16. Bernardo RJ, Haddad F, Couture EJ et al. Mechanics of right ventricular dysfunction in pulmonary arterial hypertension and heart failure with preserved ejection fraction. Cardiovasc Diagn Ther 2020;10:1580–603. https://doi.org/10.21037/cdt-20-479
17. Mushemi-Blake S, Melikian N, Drasar E et al. Pulmonary haemodynamics in sickle cell disease are driven predominantly by a high-output state rather than elevated pulmonary vascular resistance: a prospective 3-dimensional echocardiography/Doppler study. PLoS One 2015;10:e0135472. https://doi.org/10.1371/journal.pone.0135472
18. McLaughlin VV, Archer SL, Badesch DB et al. ACCF/AHA 2009 expert consensus document on pulmonary hypertension a report of the American College of Cardiology Foundation Task Force on Expert Consensus Documents and the American Heart Association developed in collaboration with the American College of Chest Physicians; American Thoracic Society, Inc.; and the Pulmonary Hypertension Association. J Am Coll Cardiol 2009;53:1573–619. https://doi.org/10.1016/j.jacc.2009.01.004
19. Meloni A, Pistoia L, Quota A et al. Prognostic value of multiparametric cardiac magnetic resonance in sickle cell patients. Ann Hematol 2023;102:261–70. https://doi.org/10.1007/s00277-022-05057-6
20. Kato GJ, Steinberg MH, Gladwin MT. Intravascular hemolysis and the pathophysiology of sickle cell disease. J Clin Invest 2017;127:750–60. https://doi.org/10.1172/JCI89741
21. Potoka KP, Gladwin MT. Vasculopathy and pulmonary hypertension in sickle cell disease. Am J Physiol Lung Cell Mol Physiol 2015;308:L314–L324. https://doi.org/10.1152/ajplung.00252.2014
22. Reiter CD, Gladwin MT. An emerging role for nitric oxide in sickle cell disease vascular homeostasis and therapy. Curr Opin Hematol 2003;10:99–107. https://doi.org/10.1097/00062752-200303000-00001
23. Machado RF, Mack AK, Martyr S et al. Severity of pulmonary hypertension during vaso-occlusive pain crisis and exercise in patients with sickle cell disease. Br J Haematol 2007;136:319–25. https://doi.org/10.1111/j.1365-2141.2006.06417.x
24. Mondal P, Stefek B, Sinharoy A, Sankoorikal BJ, Abu-Hasan M, Aluquin V. The association of nocturnal hypoxia and an echocardiographic measure of pulmonary hypertension in children with sickle cell disease. Pediatr Res 2019;85:506–10. https://doi.org/10.1038/s41390-018-0125-6
25. Stauffer E, Poutrel S, Cannas G et al. Nocturnal hypoxemia rather than obstructive sleep apnea is associated with decreased red blood cell deformability and enhanced hemolysis in patients with sickle cell disease. Front Physiol 2021;12:743399. https://doi.org/10.3389/fphys.2021.743399
26. Njoku F, Pugh N, Brambilla D et al. Mortality in adults with sickle cell disease: results from the sickle cell disease implementation consortium (SCDIC) registry. Am J Hematol 2024;99:900–09. https://doi.org/10.1002/ajh.27279
27. Mehari A, Gladwin MT, Tian X, Machado RF, Kato GJ. Mortality in adults with sickle cell disease and pulmonary hypertension. JAMA 2012;307:1254–6. https://doi.org/10.1001/jama.2012.358
28. Mehari A, Alam S, Tian X et al. Hemodynamic predictors of mortality in adults with sickle cell disease. Am J Respir Crit Care Med 2013;187:840–7. https://doi.org/10.1164/rccm.201207-1222OC
29. Khan MI, Patel N, Meda RT, Nuguru SP, Rachakonda S, Sripathi S. Sickle cell disease and its respiratory complications. Cureus 2022;14:e28528. https://doi.org/10.7759/cureus.28528
30. Young RC Jr., Rachal RE, Hackney RL Jr., Uy CG, Scott RB. Smoking is a factor in causing acute chest syndrome in sickle cell anemia. J Natl Med Assoc 1992;84:267–71. Available from: https://pmc.ncbi.nlm.nih.gov/articles/pmid/1578502/
31. Knight-Madden JM, Barton-Gooden A, Weaver SR, Reid M, Greenough A. Mortality, asthma, smoking and acute chest syndrome in young adults with sickle cell disease. Lung 2013;191:95–100. https://doi.org/10.1007/s00408-012-9435-3
32. Cohen RT, Strunk RC, Field JJ et al. Environmental tobacco smoke and airway obstruction in children with sickle cell anemia. Chest 2013;144:1323–9. https://doi.org/10.1378/chest.12-1569
33. Oni OO, Odeyemi AO, Olasinde YT et al. Pulmonary hypertension and left ventricular geometric types in sickle cell anemia. Am J Cardiol 2023;203:175–83. https://doi.org/10.1016/j.amjcard.2023.06.100
